Shop for fire detectors with rapid auto-optimisation in Kryptos
27 fire optimisations in one hour on the Huldra cellar deck compare three detector models side by side: 513 detectors placed and over 118,000 positions tried, and the model with the shortest range needed the fewest detectors.
8 min read
Which fire detector should we buy? The datasheet cannot answer that. A longer range sounds better, and so does a wider view. Which one covers your deck with the fewest detectors depends on the deck itself: its size, its equipment and where the detectors can go.
A fire mapping can answer it, but only if one run is quick enough to repeat. In Kryptos, it is. In one hour on a real offshore deck, we ran 27 fire optimisations. They placed 513 detectors across 27 optimisations after trying over 118,000 positions, and compared three detector models from the same maker. That is the speed that lets you shop for detectors inside Kryptos: try each model on your own deck and buy the one that covers it with the fewest detectors.
This post is the shopping trip. The step-by-step setup of a fire mapping, from creating the area to exporting the detectors, is in Fire detectors auto-placed and aimed by Kryptos on a real offshore deck, in 63 seconds. Follow it first if you have not run a fire mapping before.
| All 27 runs | |
|---|---|
| Total time | 1 hour |
| Average time per run | about 2 minutes |
| Detectors placed | 513 |
| Positions tried | over 118,000 |
| Detectors placed per minute | about 9 |
Measured on a laptop with an Intel Core i7, 16 GB of RAM and 8 GB of graphics memory.
The deck and the detectors
The model is the Huldra platform, an open offshore model imported straight from its Navisworks file. We mapped its cellar deck, a 38 × 40 × 5 m box packed with pumps, vessels, pipe racks and walkways. For fire detectors, that clutter is the hard part. Every vessel and pipe rack blocks a detector’s view, so a detector that sees well on an open deck can be half blind here.
The targets were the same in every run: 90% of the grade seen by at least one detector (1ooN) and 80% seen by at least two (2ooN).
We compared three flame detectors from the same maker, MSA General Monitors. A Detector Database in the area ribbon holds every model you add to the project, and each one shows up in the Detector list in Area Settings. When you pick a model, Kryptos fills in its range, its field of view and its curvature from the datasheet.
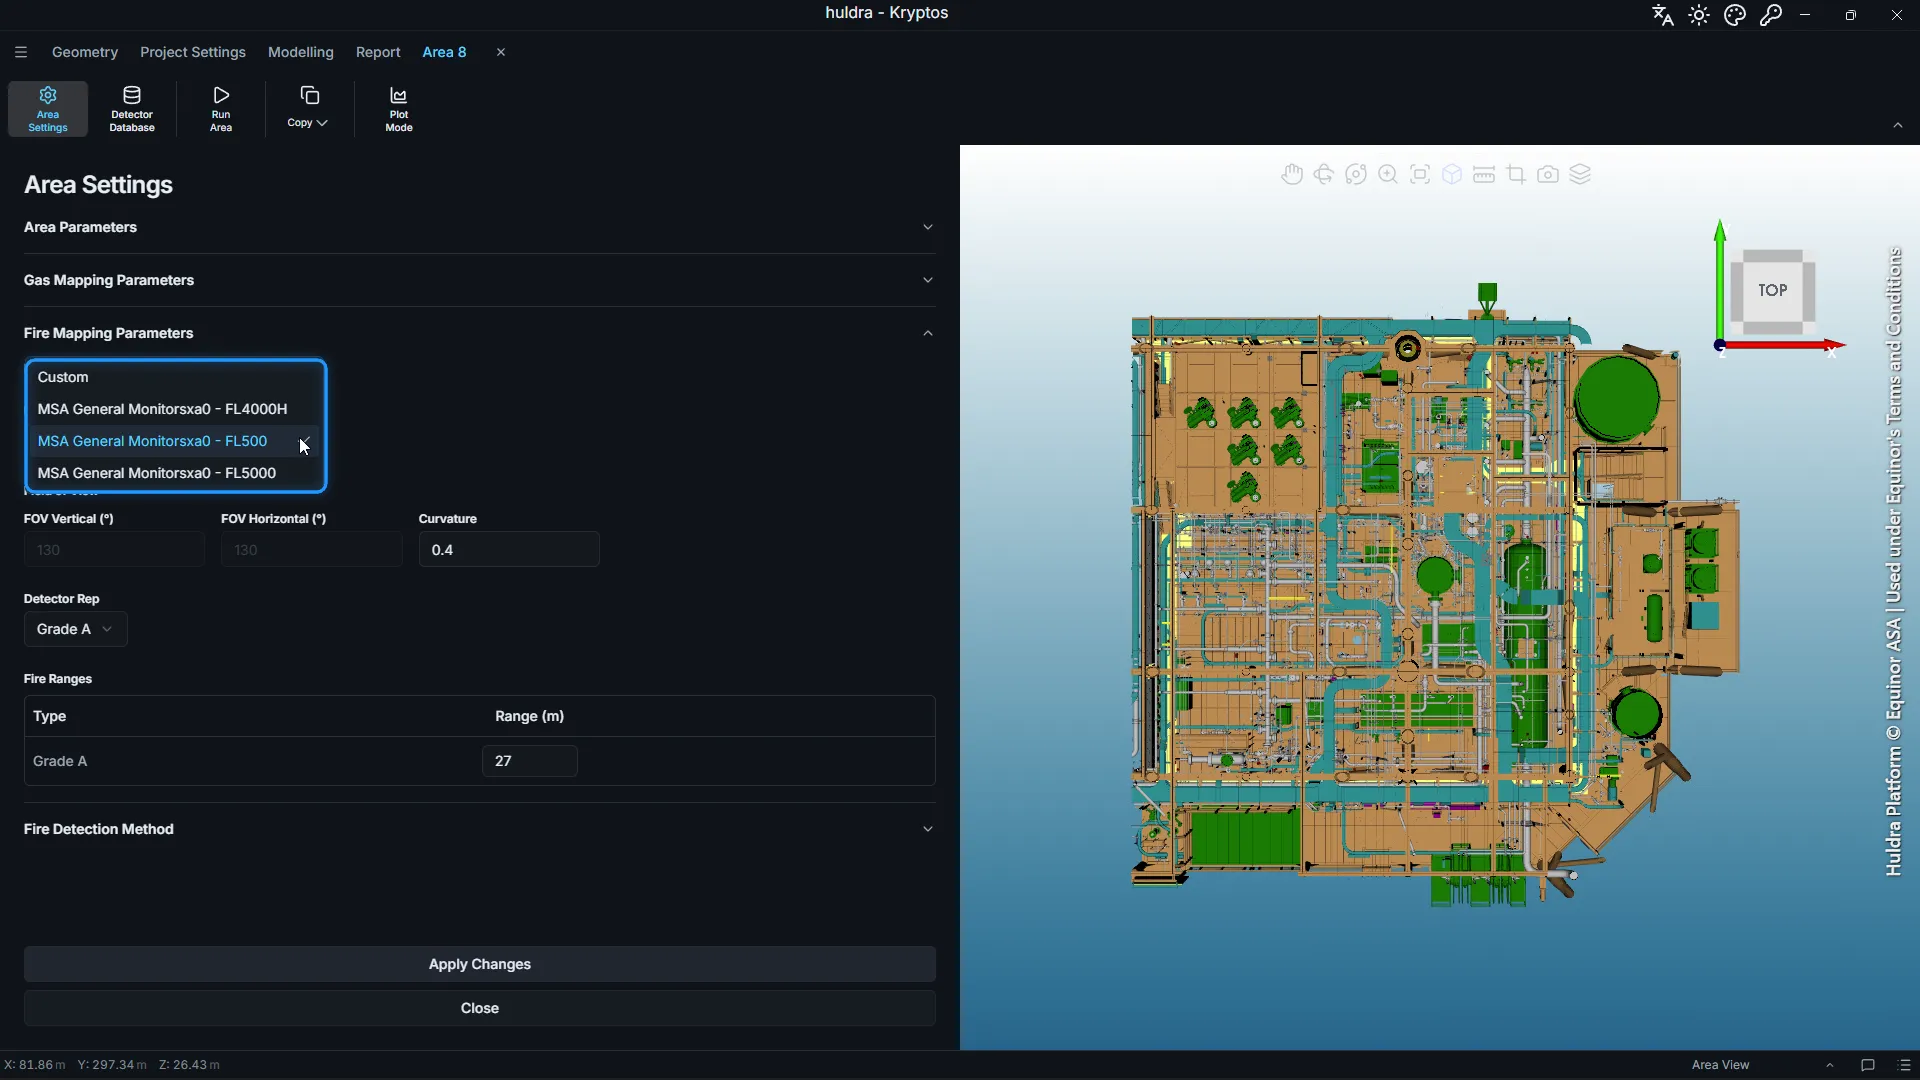
| Model | Range | FOV across | FOV up and down |
|---|---|---|---|
| FL500 | 27 m | 130° | 130° |
| FL4000H | 30 m | 100° | 100° |
| FL5000 | 34 m | 90° | 90° |
How a fire counts as seen
Every run used the same fire detection method, Fire Area (Varying), so the comparison stays fair. A fire is a flat patch of the size you enter under Fire Size. We used 0.3 m wide and 0.9 m high. A detector must see part of that patch, and how much depends on how far away the fire is:
- Minimum Visible Portion (%) at Maximum Detector Range: how much of the fire must be visible when it is as far away as the detector can see. We used 100%: at the edge of the range, the whole fire must be in view.
- Minimum Visible Portion (%): the least it ever asks for. Closer in, the share needed drops quickly, following the inverse-square law, but never below this. We used 10%.
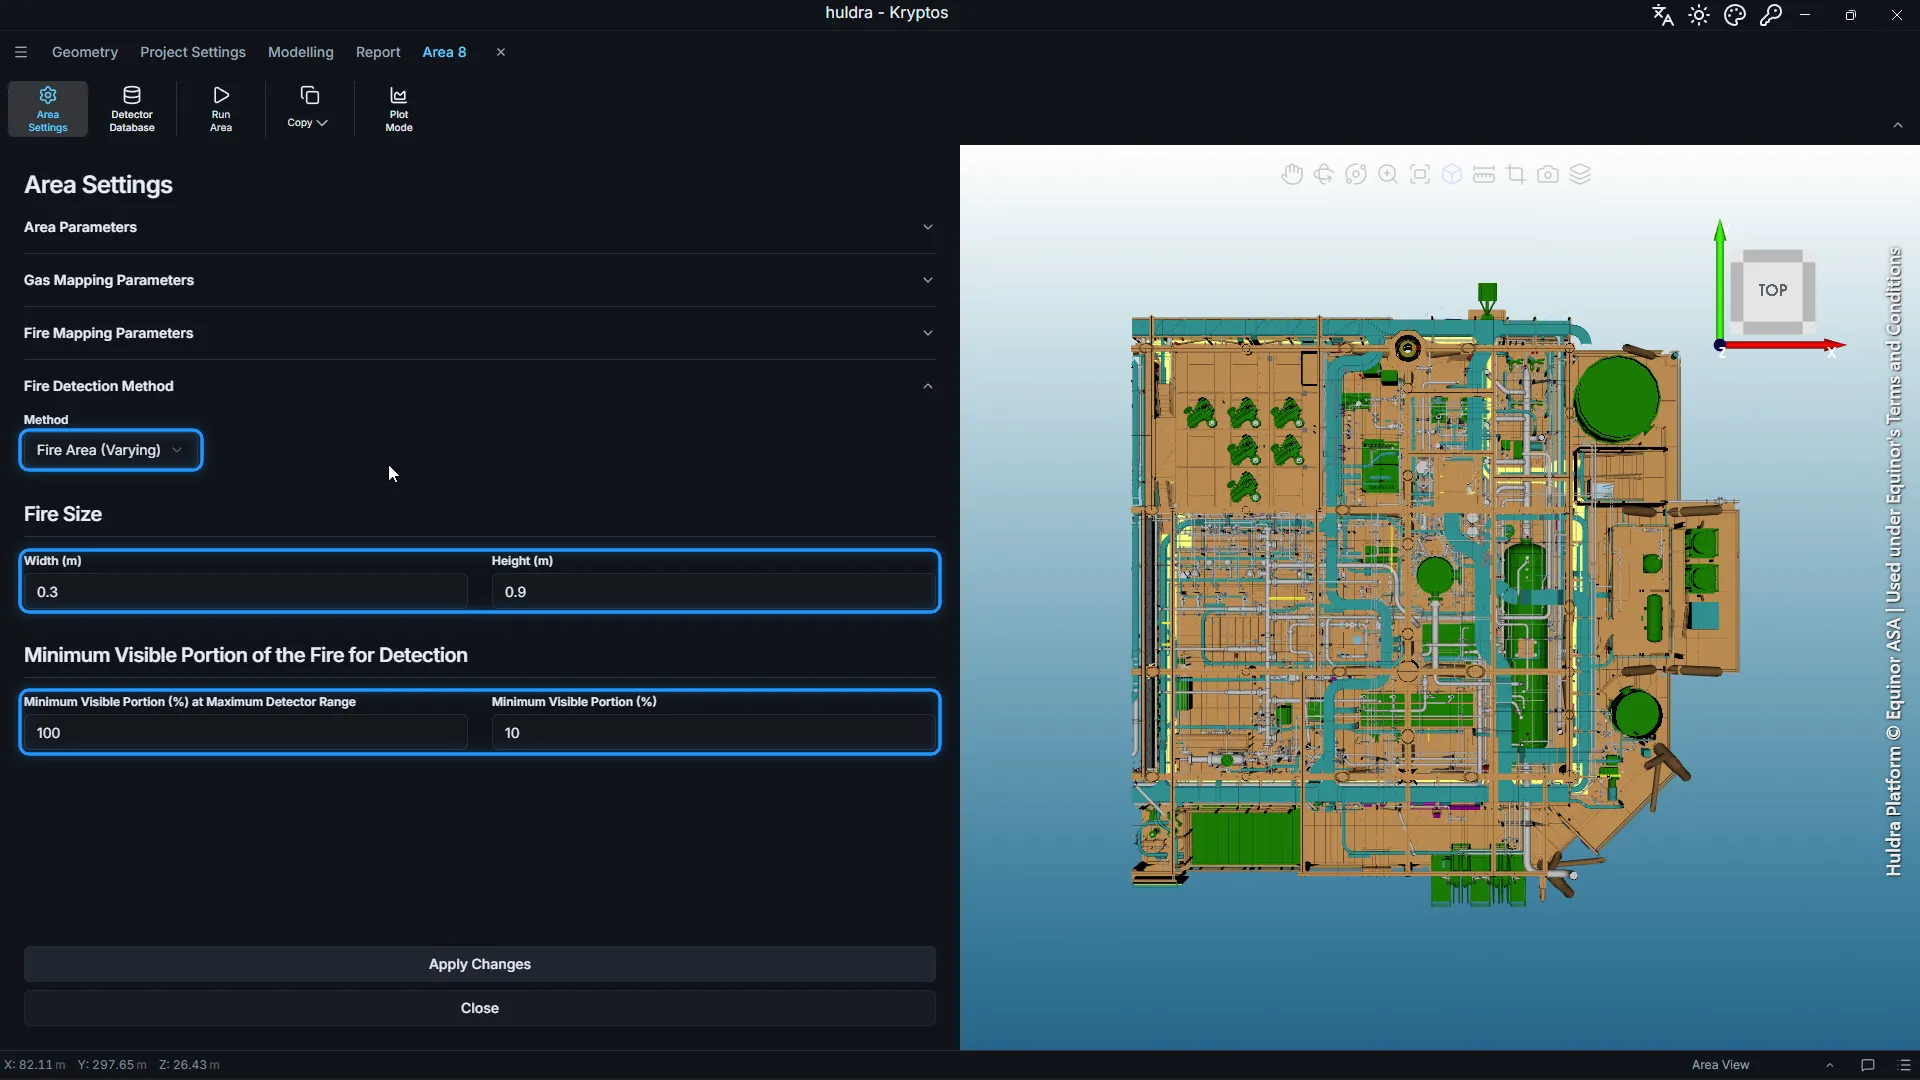
This is how a real flame detector behaves. A fire close by looks large and bright, so a glimpse of it is enough. A fire at the edge of the range needs to be in full view. For more on the fire area methods, see Fire Calculation Methods in the Kryptos documentation.
What we changed
We kept the cellar deck, the targets and the fire detection method, and changed three things:
- The detector model: FL500 (27 m, 130°), FL4000H (30 m, 100°) and FL5000 (34 m, 90°).
- How tall the risk grade is: 3 m, 4 m and 5 m. A taller grade is more space to see into, so it needs more detectors.
- Where detectors may be mounted: only on the normal deck, on the normal and the hanging deck, or only on the hanging deck. A hanging deck is a spot such as an access platform or a support pillar, where a detector can be hung looking down.
Three models, three grade heights and three ways of mounting gives 27 optimisations. All 27 ran in one hour.
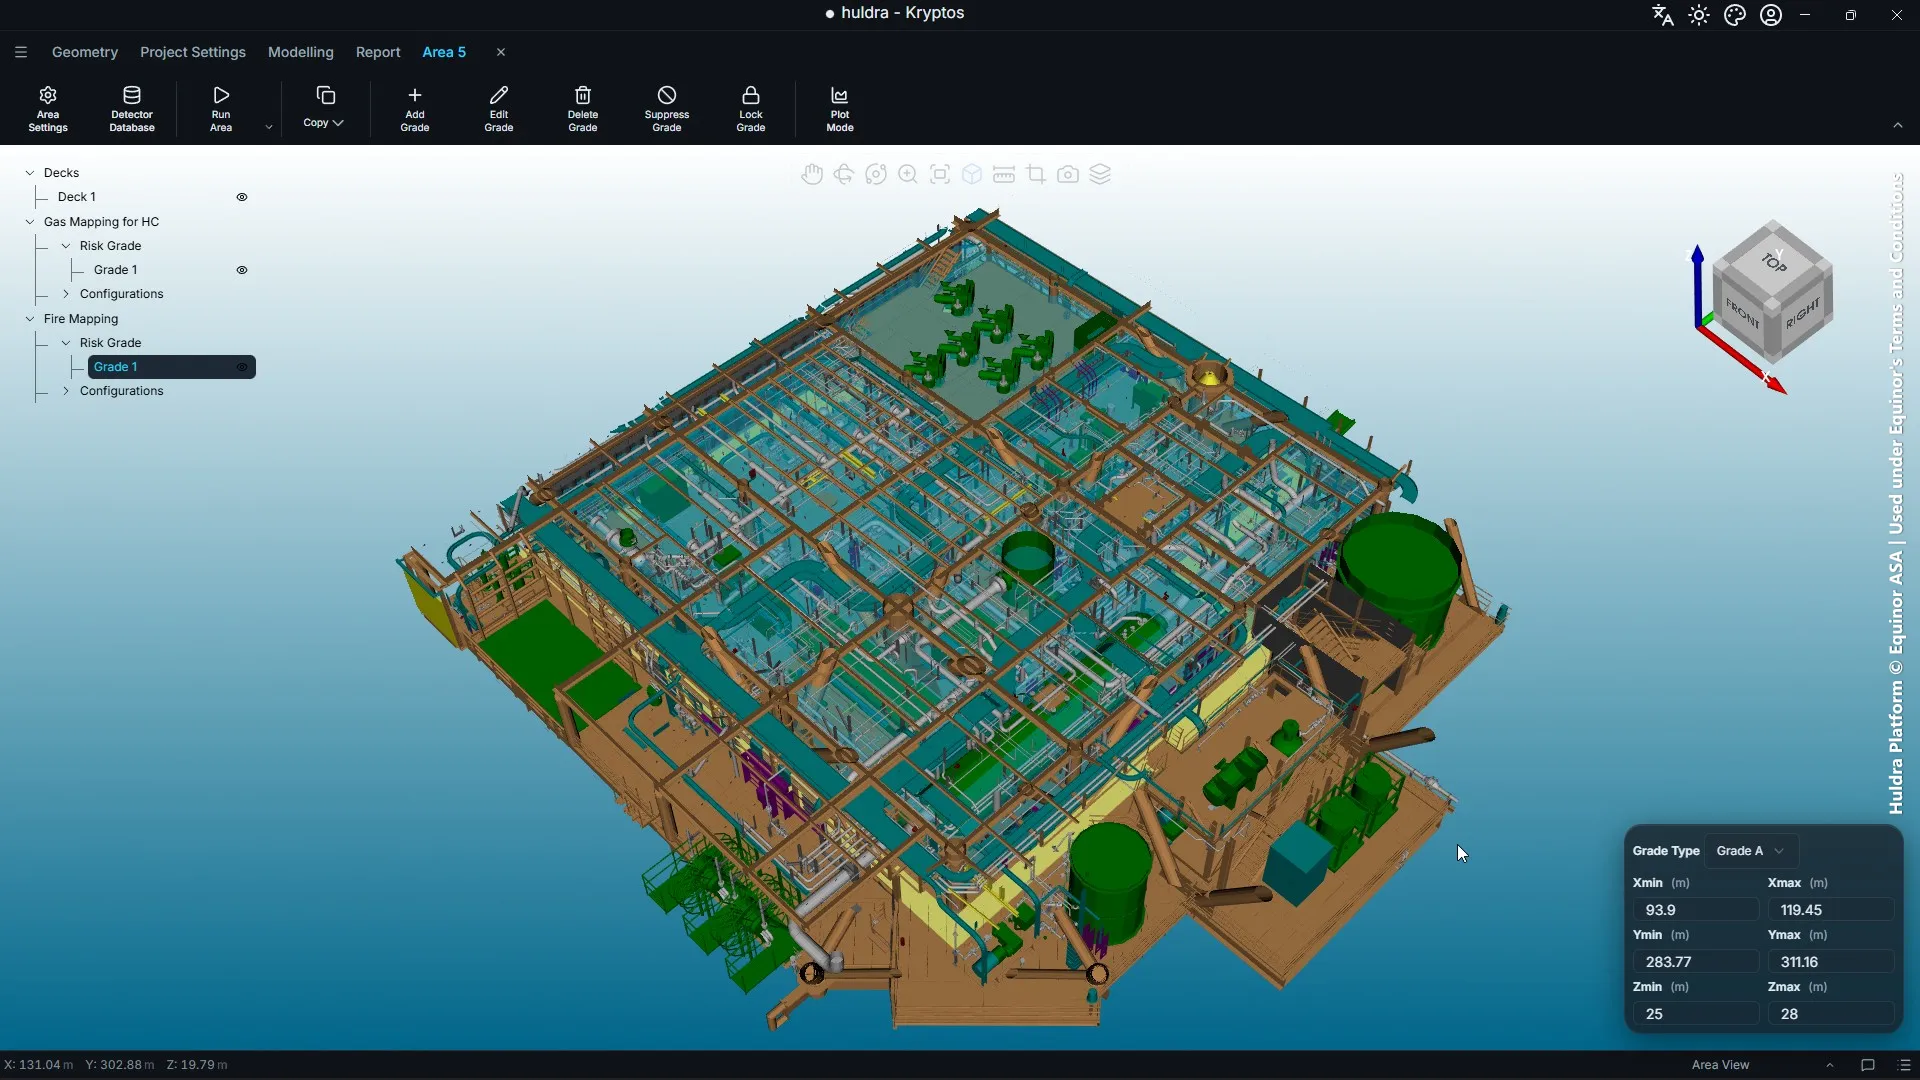
The blue highlighted part is the risk grade. It is 25 × 27 m across in every run, but its height changes with the case: 3 m, 4 m or 5 m.
What each detector needed
The number of detectors each run placed to reach 90% at 1ooN and 80% at 2ooN:
Grade 5 m tall
| Detector | Only normal deck | Normal + hanging deck | Only hanging deck |
|---|---|---|---|
| FL500 | 17 | 18 | 21 |
| FL4000H | 20 | 22 | 24 |
| FL5000 | 21 | 22 | 24 |
Grade 4 m tall
| Detector | Only normal deck | Normal + hanging deck | Only hanging deck |
|---|---|---|---|
| FL500 | 17 | 17 | 20 |
| FL4000H | 20 | 19 | 23 |
| FL5000 | 20 | 22 | 23 |
Grade 3 m tall
| Detector | Only normal deck | Normal + hanging deck | Only hanging deck |
|---|---|---|---|
| FL500 | 12 | 12 | 18 |
| FL4000H | 14 | 15 | 21 |
| FL5000 | 15 | 15 | 21 |
Added up over the nine cases:
| Detector | Detectors over all 9 cases |
|---|---|
| FL500 (27 m, 130°) | 152 |
| FL4000H (30 m, 100°) | 178 |
| FL5000 (34 m, 90°) | 183 |
What the shopping trip showed
- The detector with the shortest range won every case. The FL500 needed the fewest detectors in all nine cases, between 2 and 5 fewer than the other two models. On a 38 × 40 m deck, 27 m of range already reaches across most of it. What runs out first is the view around equipment, and the FL500’s 130° view sees more of the deck from each spot.
- Over all nine cases, that is 31 fewer detectors than the FL5000, about one in six. Each detector you do not need is one less to buy, mount, wire, test and maintain for the life of the plant.
- Mounting only on the hanging deck cost more detectors. With the FL500 and a 3 m grade, it took 18 detectors instead of 12. Detectors that can only hang from above see less of the floor between the equipment.
- Adding the hanging deck to the normal deck did not help here. It gave the same count or one more. On another deck, with tall equipment that blocks the view from below, it could.
- A taller grade needs more detectors. With the FL500 on the normal deck, going from a 3 m grade to a 5 m grade took the count from 12 to 17.
None of this was clear from the datasheets. A longer range looks like the better buy on paper, and on this deck it was the worse one. Each answer came from a run that took about two minutes.
Shop for your own detectors
You can run the same comparison on your plant, with the models you are thinking of buying:
- In the area ribbon, open the Detector Database and add every model you want to compare. Each one you add shows up in the Detector list in Area Settings.
- Pick the first model in Area Settings → Fire Mapping Parameters, check its Fire Ranges and click Apply Changes.
- Click Run Area, add a new empty configuration and click Start Optimisation.
- Rename the configuration after the model, such as “FL500, normal deck”, so you can tell the results apart.
- Repeat for the next model. Each result stays in the tree as its own configuration.
- Compare the number of detectors each model needed to meet the same targets, and look at the plots to see where each one struggles.
Change one thing at a time, such as the model, the grade height or where detectors may be mounted, and keep everything else the same. Then the difference in detector count comes from that one change.
When you have picked the winner, set its configuration as the Final Configuration with Set Configuration, and the one you started from as the Preliminary Configuration. On the Report tab, switch the summary to Fire Mapping to compare the two, and click Export to Excel.
Tip: The cheapest detector to buy is not always the cheapest layout. A model that costs more each can still come out cheaper if it needs fewer of them. With the detector counts from Kryptos, you can compare the total cost of each layout, not just the price of one detector.
What’s next
Turn the results into a Word report, in one language or two side by side. See Your Fire & Gas report, in 31 languages or two side by side.
Credits and acknowledgements
The plant model in this post is the Huldra platform, © Equinor ASA, used under Equinor’s Terms and Conditions. Our thanks to Equinor for making the Huldra data openly available, which lets us show Kryptos working on a real offshore platform.
Every screenshot and video that shows the model carries this credit. Equinor has not reviewed or endorsed this post or Kryptos.
Model credit: Huldra Platform © Equinor ASA | Used under Equinor's Terms and Conditions