Fire detectors auto-placed and aimed by Kryptos on a real offshore deck, in 63 seconds
A step-by-step fire mapping of the Huldra cellar deck, 38 × 40 × 5 m, with all three fire detection methods timed: 11 detectors in 1 minute 3 seconds, 19 in 2 minutes 18 seconds and 53 in 5 minutes.
15 min read
A fire detector has a position, a direction and a tilt, and each one changes what it can see. That makes fire layouts slow to get right by hand. Move one detector and the coverage of every detector around it changes.
Kryptos places and aims the detectors for you, fast enough to change how you work. This guide does a full fire mapping of one real deck, step by step, from turning fire mapping on to exporting the detectors to Excel. It times the part that usually takes the longest: placing the detectors. We ran each of the three fire detection methods on the same deck, and the table below shows the summary:
| Fire detection method | Detectors placed | Time | Positions tried | 1ooN | 2ooN | Time to find optimised position per detector |
|---|---|---|---|---|---|---|
| Fire Area (Varying) | 11 | 1 min 3 s | 3,207 | 94.0% | 80.9% | 5.7 s |
| Fire Area (Fixed) | 19 | 2 min 18 s | 7,021 | 93.9% | 80.6% | 7.3 s |
| Point | 53 | 5 min | 18,626 | 91.3% | 80.2% | 5.7 s |
All three met the same targets of 90% at 1ooN and 80% at 2ooN on the same deck.
The deck we used
The model is the Huldra platform, an open offshore model imported straight from its Navisworks file. We mapped its cellar deck. See Navisworks file import done in just about a minute for how it was brought in.
The cellar deck is the lowest process deck of the topside, packed with pumps, vessels, pipe racks and walkways. For fire detectors, that clutter is the hard part. Every vessel and pipe rack blocks a detector’s view, so a detector that sees well on an open deck can be half blind here.
| Size | |
|---|---|
| Length (X) | 38.18 m |
| Width (Y) | 39.62 m |
| Height (Z) | 4.7 m |
| Floor area | about 1,513 m² |
In round numbers, a 38 × 40 × 5 m box.
The settings for the timed runs:
- Detector: MSA General Monitors FL500, with a range of 27 m and a 130° field of view, both across and up and down. Curvature 0.4.
- Risk grade: Grade A over the whole deck.
- Fire size: 0.3 × 0.9 m (1 ft × 3 ft), for the two fire area methods.
- Targets: 90% of the deck seen by at least one detector (1ooN) and 80% seen by at least two (2ooN).
- Detector heights: 2 m to 5 m above the deck, tilted between 5° and 40° down.
Step 1: Create the area
An area is the part of the plant you are mapping, usually one fire zone. Here, it is the cellar deck.
- Open the Modelling tab and click Create Area.
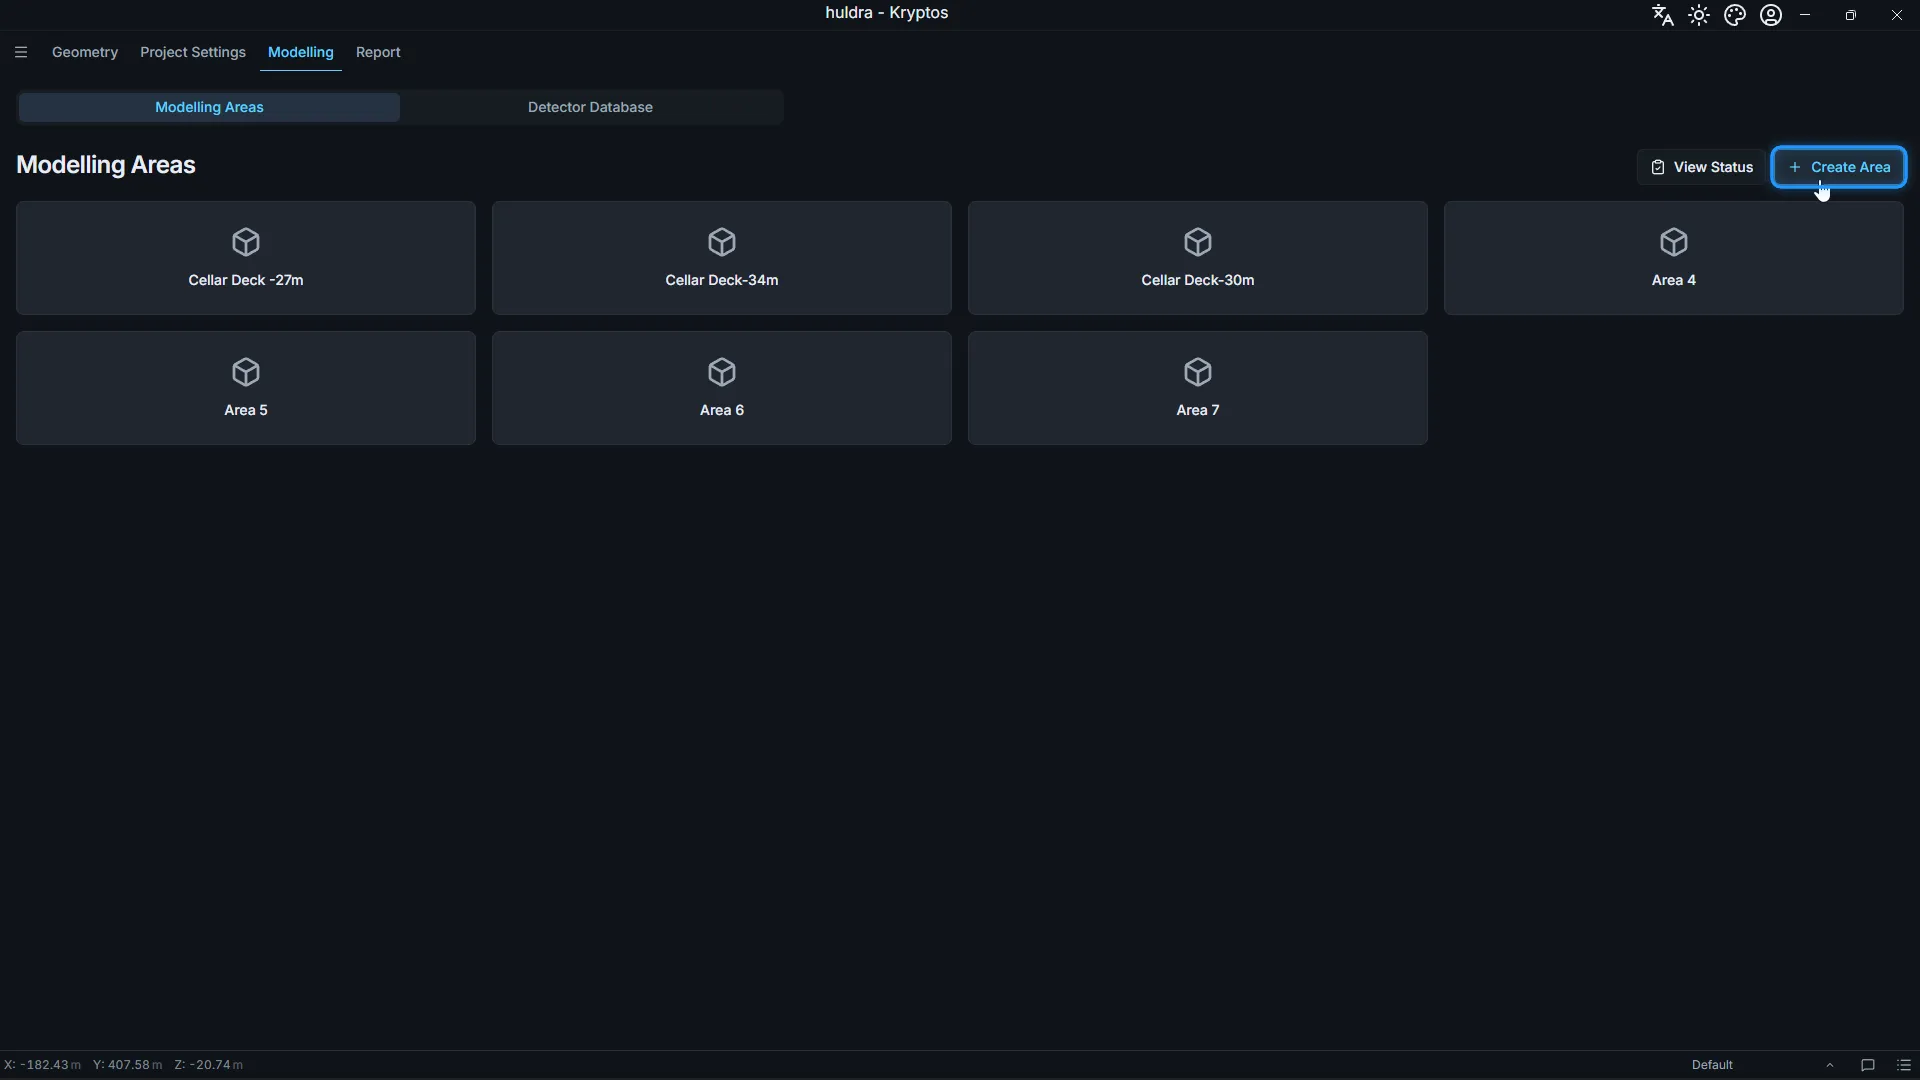
- The new area opens on Area Settings. Under Area Parameters, enter the Min and Max of each axis, or drag the white handles in the 3D view.
For the cellar deck, X runs from 92.9 m to 131.08 m, Y from 274.78 m to 314.4 m, and Z from 24.08 m to 28.78 m. Kryptos shows the size this gives under the boxes: ΔX 38.18 m, ΔY 39.62 m, ΔZ 4.7 m.
Tip: Keep the area close to the equipment inside it. Every extra metre is more space to check, which makes the run slower and the plots harder to read.
In the screenshots, the area is called Area 8. Give yours a name people will recognise in the report, such as the deck name.
Step 2: Turn on fire mapping and pick the detector
- In Area Settings, open Fire Mapping Parameters and tick Mapping Enabled.
- Pick the Detector model.
- Under Fire Ranges, check the range for each grade. We used 27 m for Grade A.
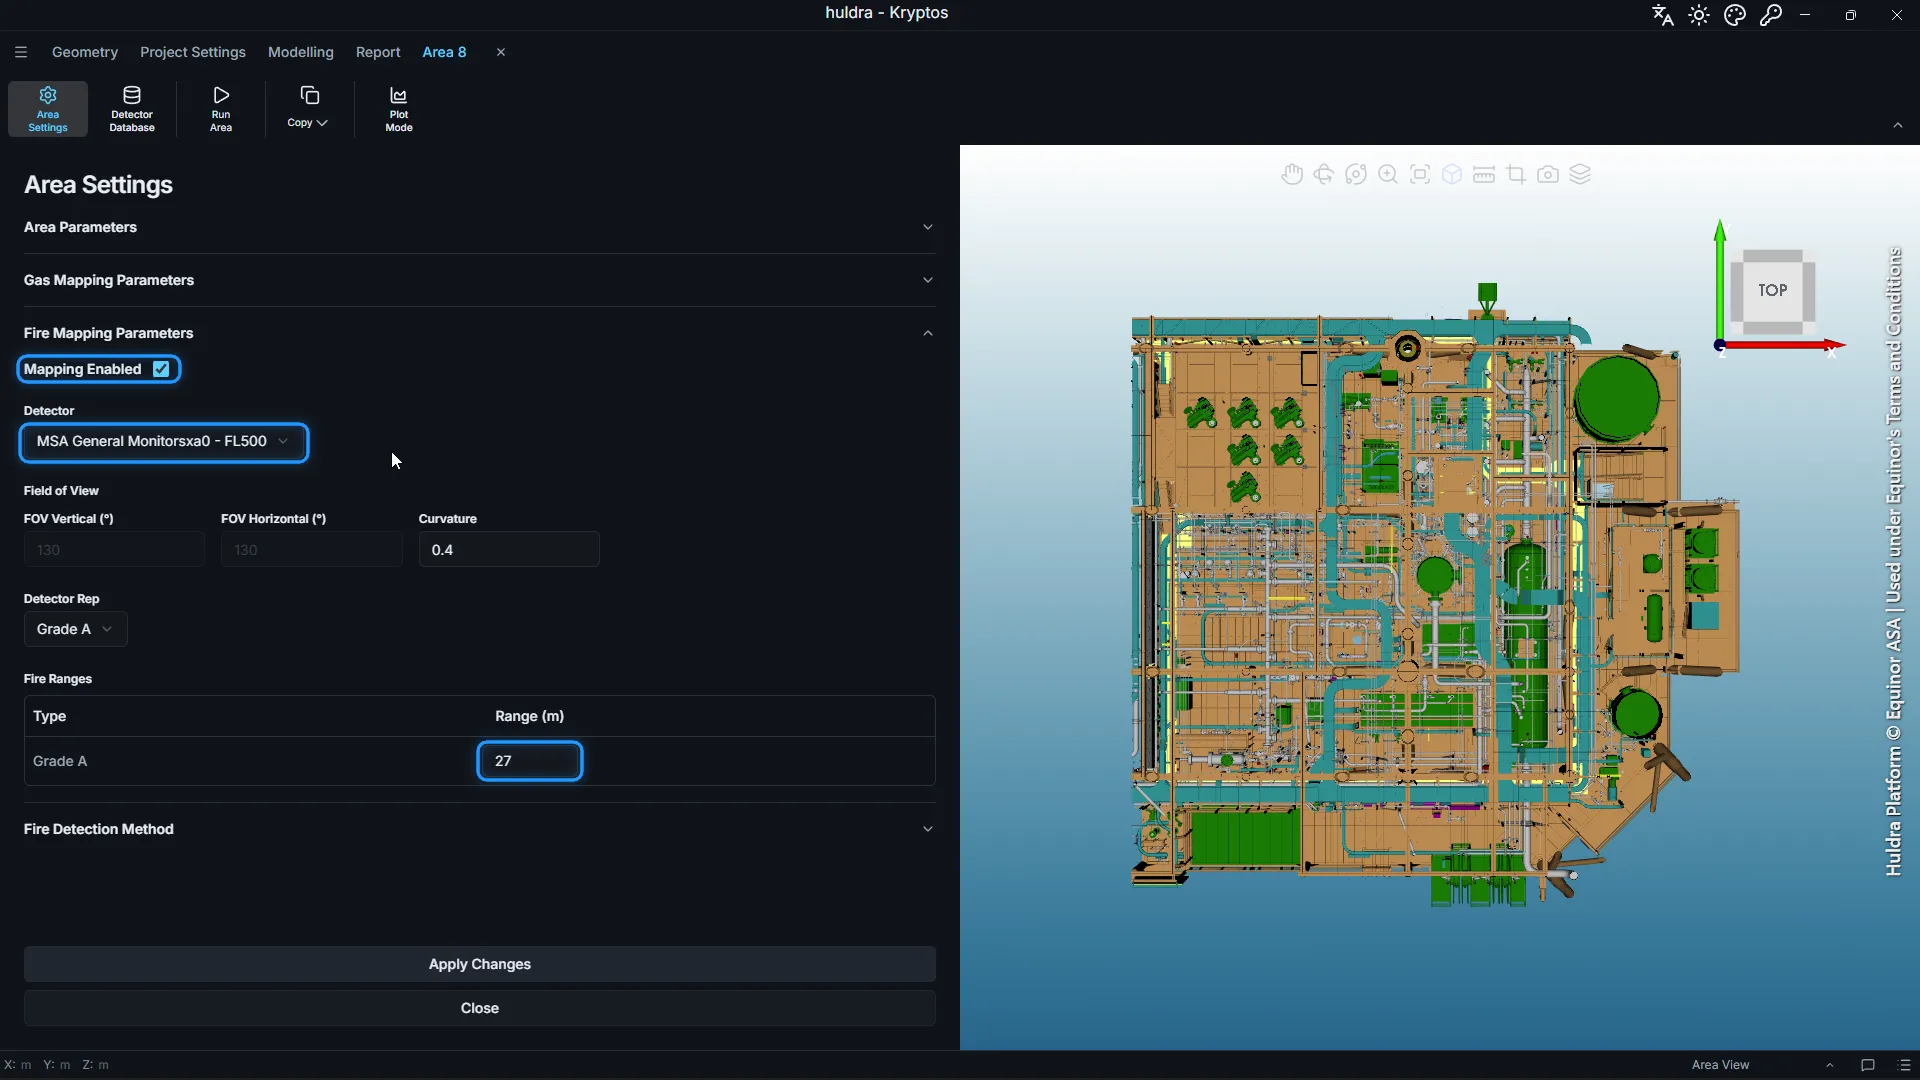
When you pick a detector, Kryptos fills in its FOV Vertical and FOV Horizontal (how wide it sees, up and down and across) and its Curvature from the datasheet. The FOV boxes are greyed out because their values come with the model.
The Detector list holds every fire detector you have added to the project from the Detector Database in the ribbon. We added three MSA General Monitors models, the three we compare in Shop for fire detectors with rapid auto-optimisation in Kryptos. Choose Custom to type in the values for a detector that is not in the database.
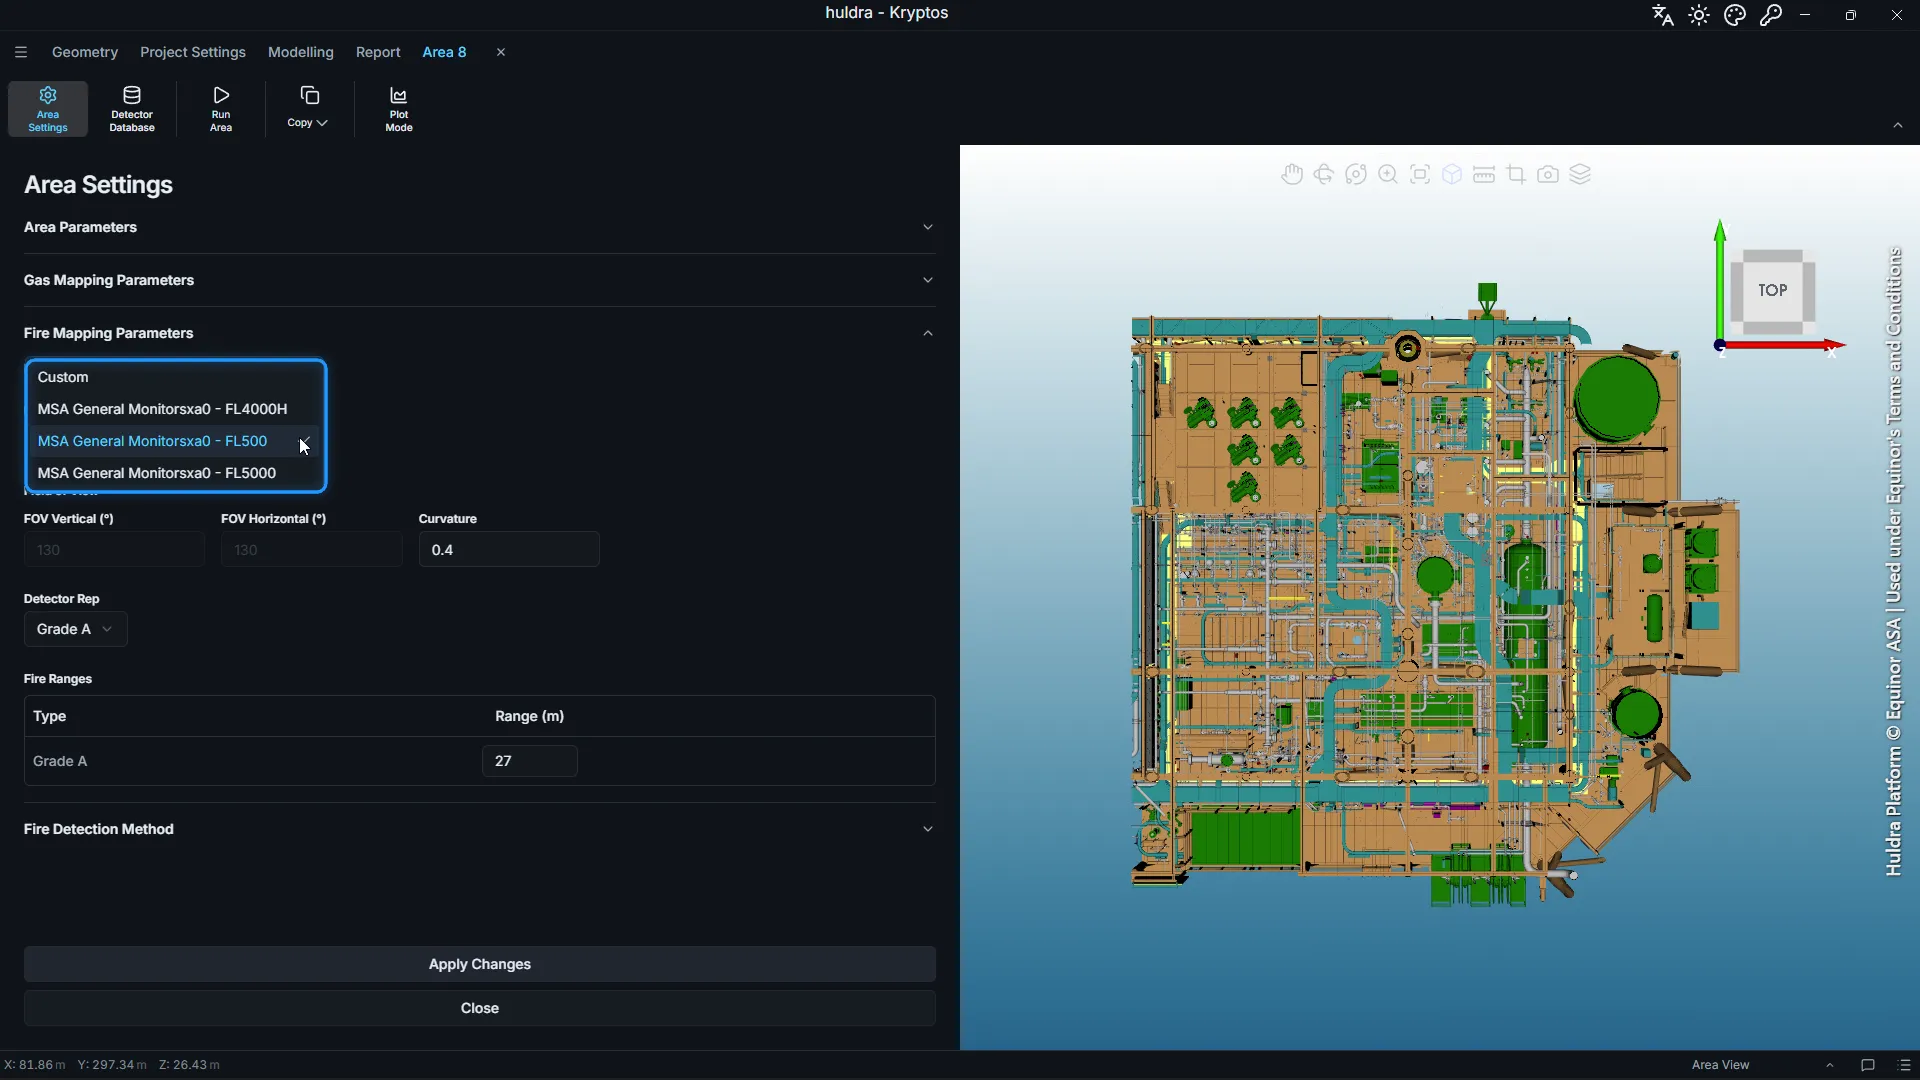
| Model | Range | FOV across | FOV up and down |
|---|---|---|---|
| FL500 | 27 m | 130° | 130° |
| FL4000H | 30 m | 100° | 100° |
| FL5000 | 34 m | 90° | 90° |
Detector Rep only sets which grade’s range is used to draw each detector in the 3D view. It does not change the results.
Click Apply Changes. Fire mapping is only created once you apply.
Step 3: Choose how a fire counts as seen
Open Fire Detection Method in the same window. This is the biggest choice in a fire mapping. It decides when a fire counts as seen, and so how many detectors you need. Kryptos has three methods.
Fire Area (Varying)
A fire is a flat patch of the size you enter under Fire Size. We used 0.3 m wide and 0.9 m high. The detector must see part of that patch, and how much depends on how far away the fire is:
- Minimum Visible Portion (%) at Maximum Detector Range: how much of the fire must be visible when it is as far away as the detector can see. We used 100%: at 27 m, the whole fire must be in view.
- Minimum Visible Portion (%): the least it ever asks for. Closer in, the share needed drops quickly, following the inverse-square law, but never below this. We used 10%.
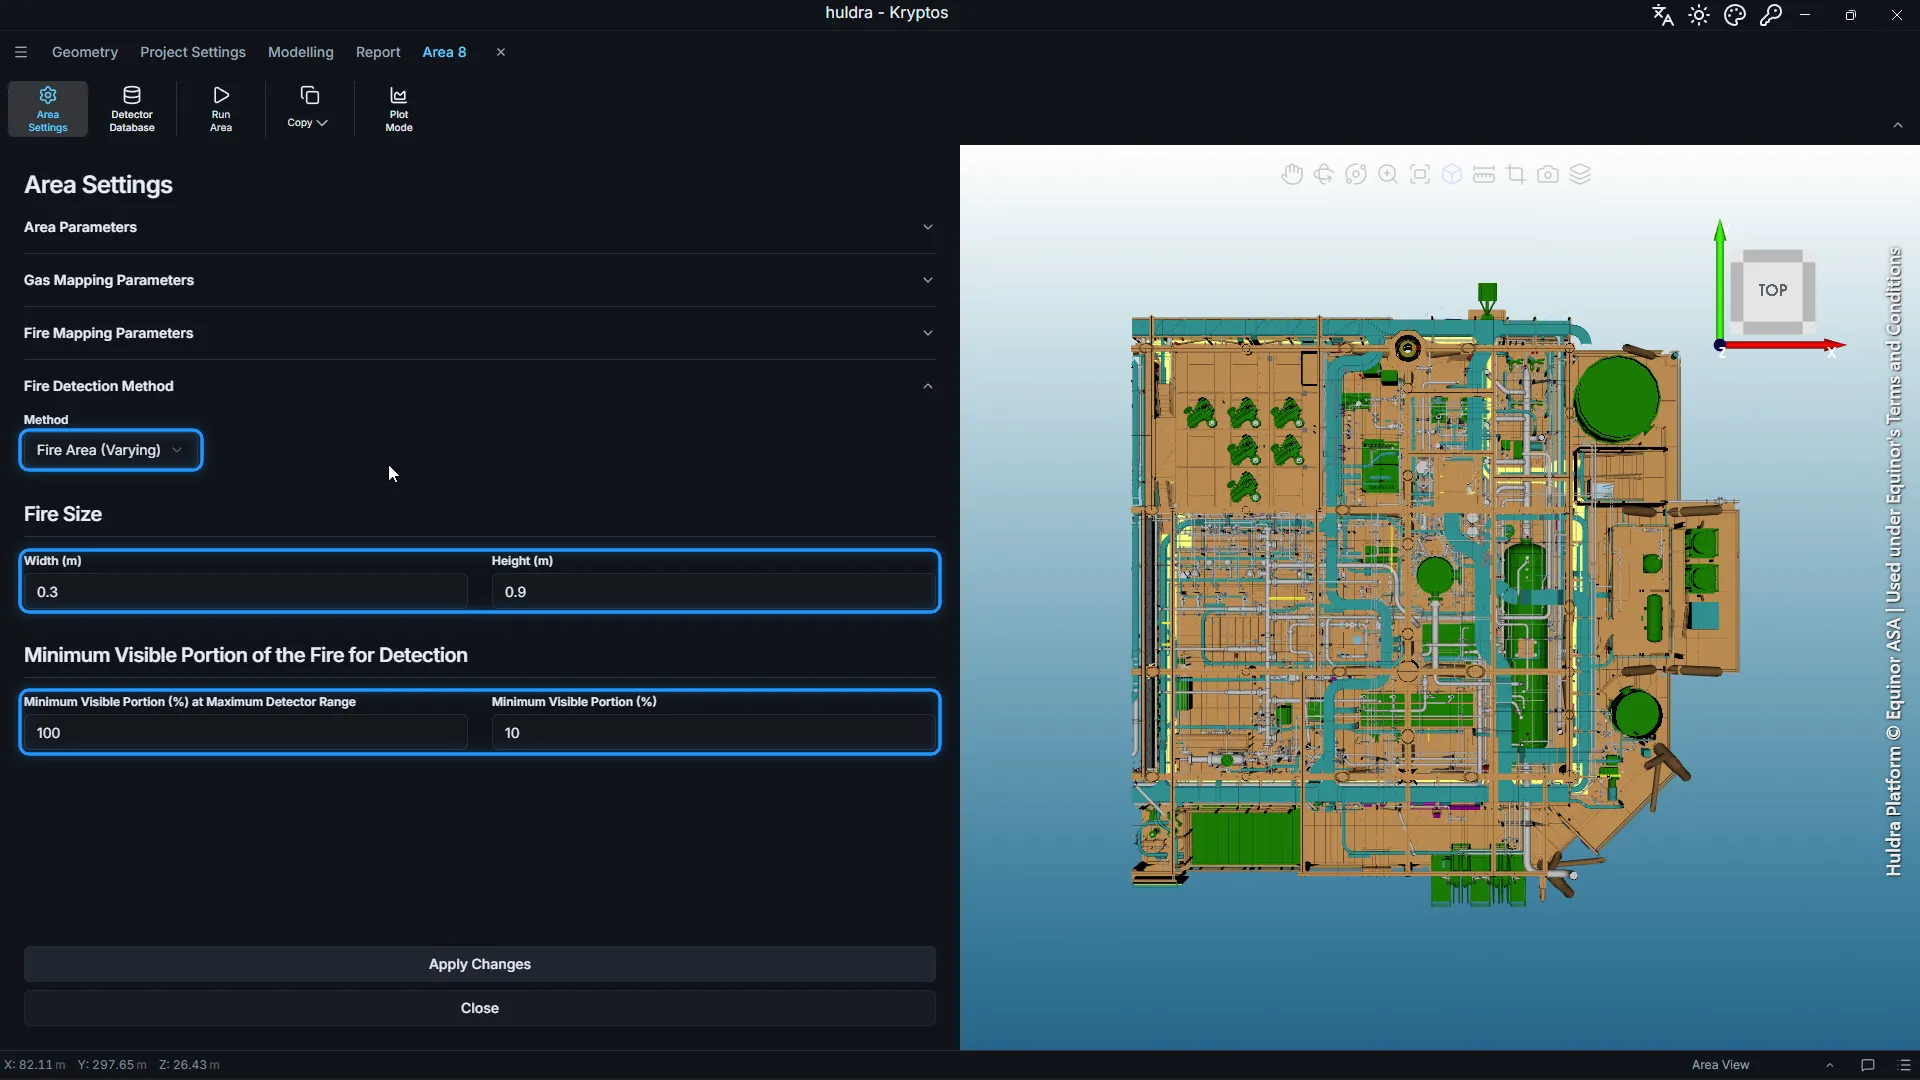
This is how a real flame detector behaves. A fire close by looks large and bright, so a glimpse of it is enough. A fire at the edge of the range needs to be in full view.
Fire Area (Fixed)
The same fire patch, but the share that must be visible is the same at every distance. We used 50%, with the same 0.3 × 0.9 m fire.
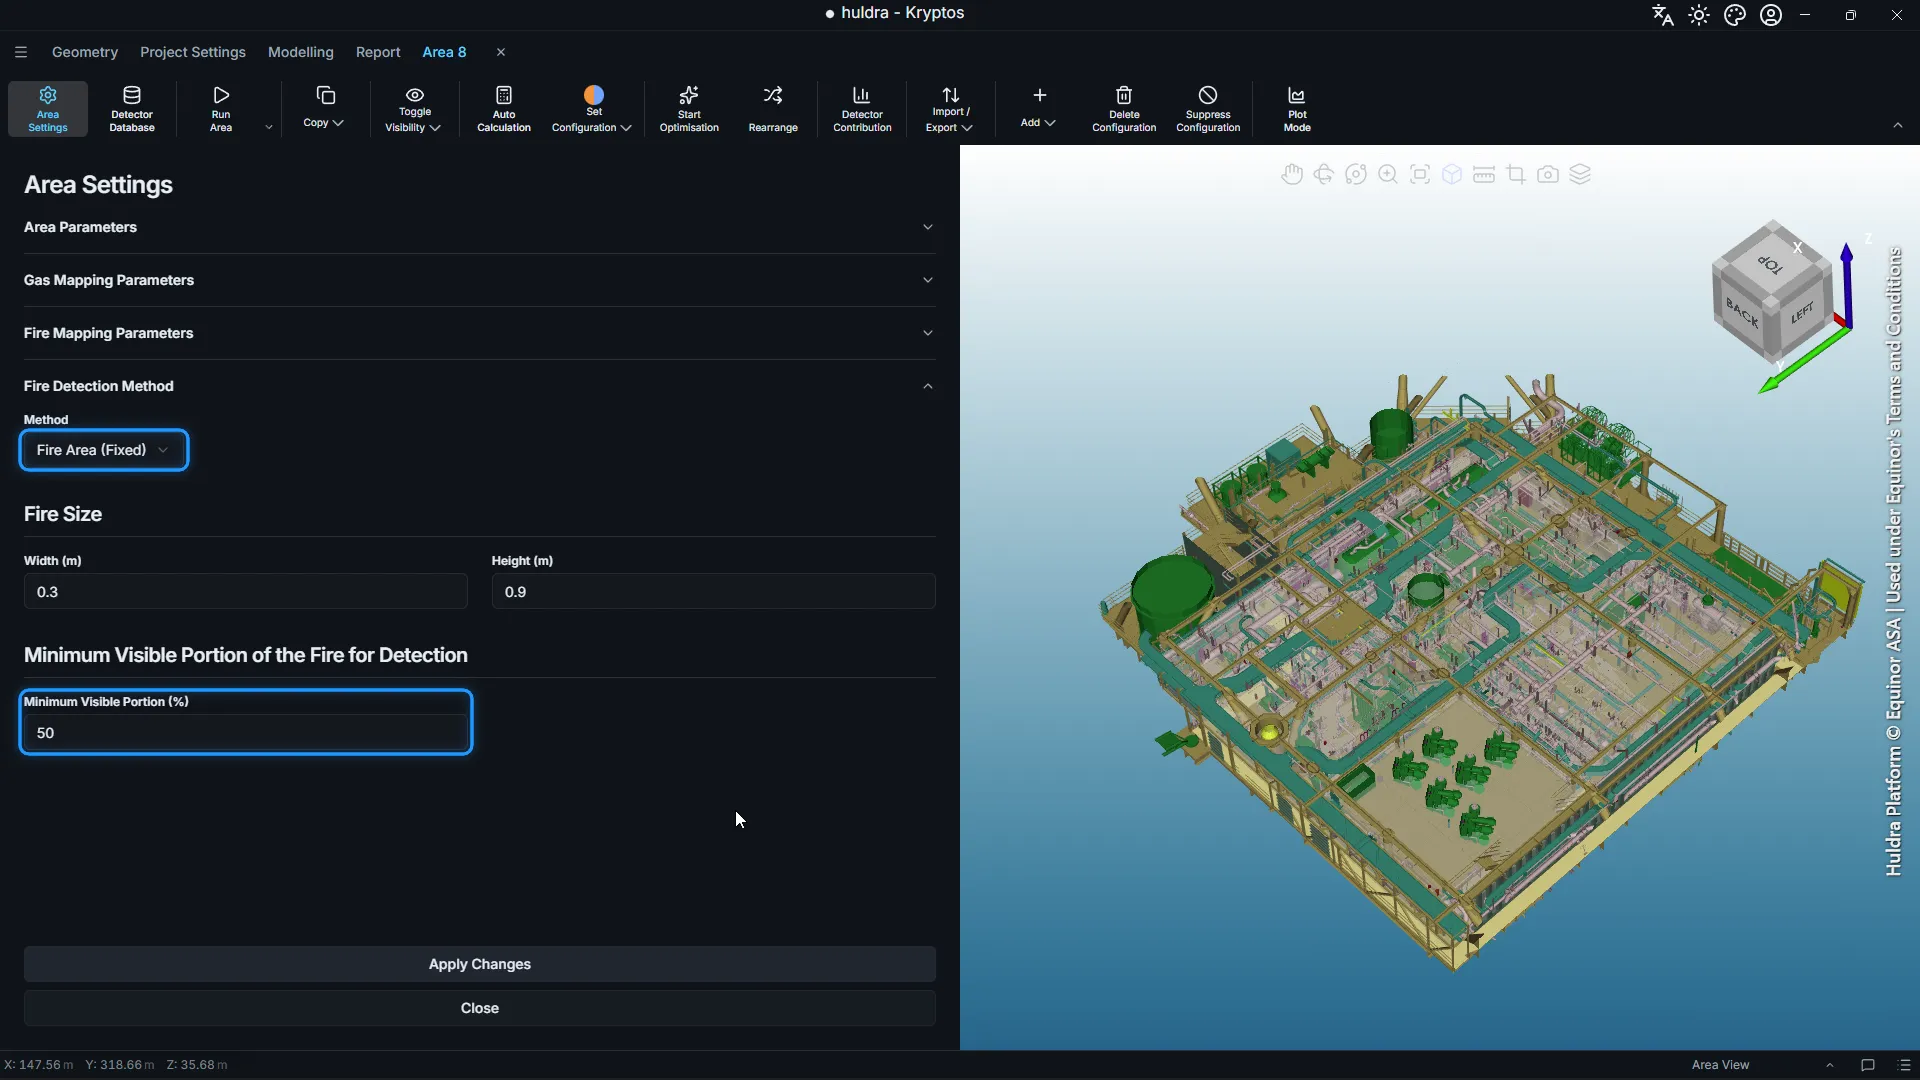
Point
No fire size and no visible share. A point in the grade counts as seen when it is within a detector’s range and field of view, and nothing blocks the line between them. This method only uses the detector settings from Step 2.
Pick the method you want to run first and click Apply Changes.
Learn about the methods in detail
Each method has more to it than fits here: how the fire size is used, how the visible share is worked out at each distance, and when each method suits a project. The Fire Calculation Methods page in the Kryptos documentation covers all three, including the fire area methods, with every setting explained.
Tip: Your Fire & Gas philosophy may already say which method to use. If it does not, run more than one. As the next sections show, each run takes minutes.
Step 4: Draw the risk grade
A risk grade marks where a fire could start and how serious it would be. We drew one grade over the whole cellar deck.
- In the area tree, select Risk Grade under Fire Mapping, then click Add Grade.
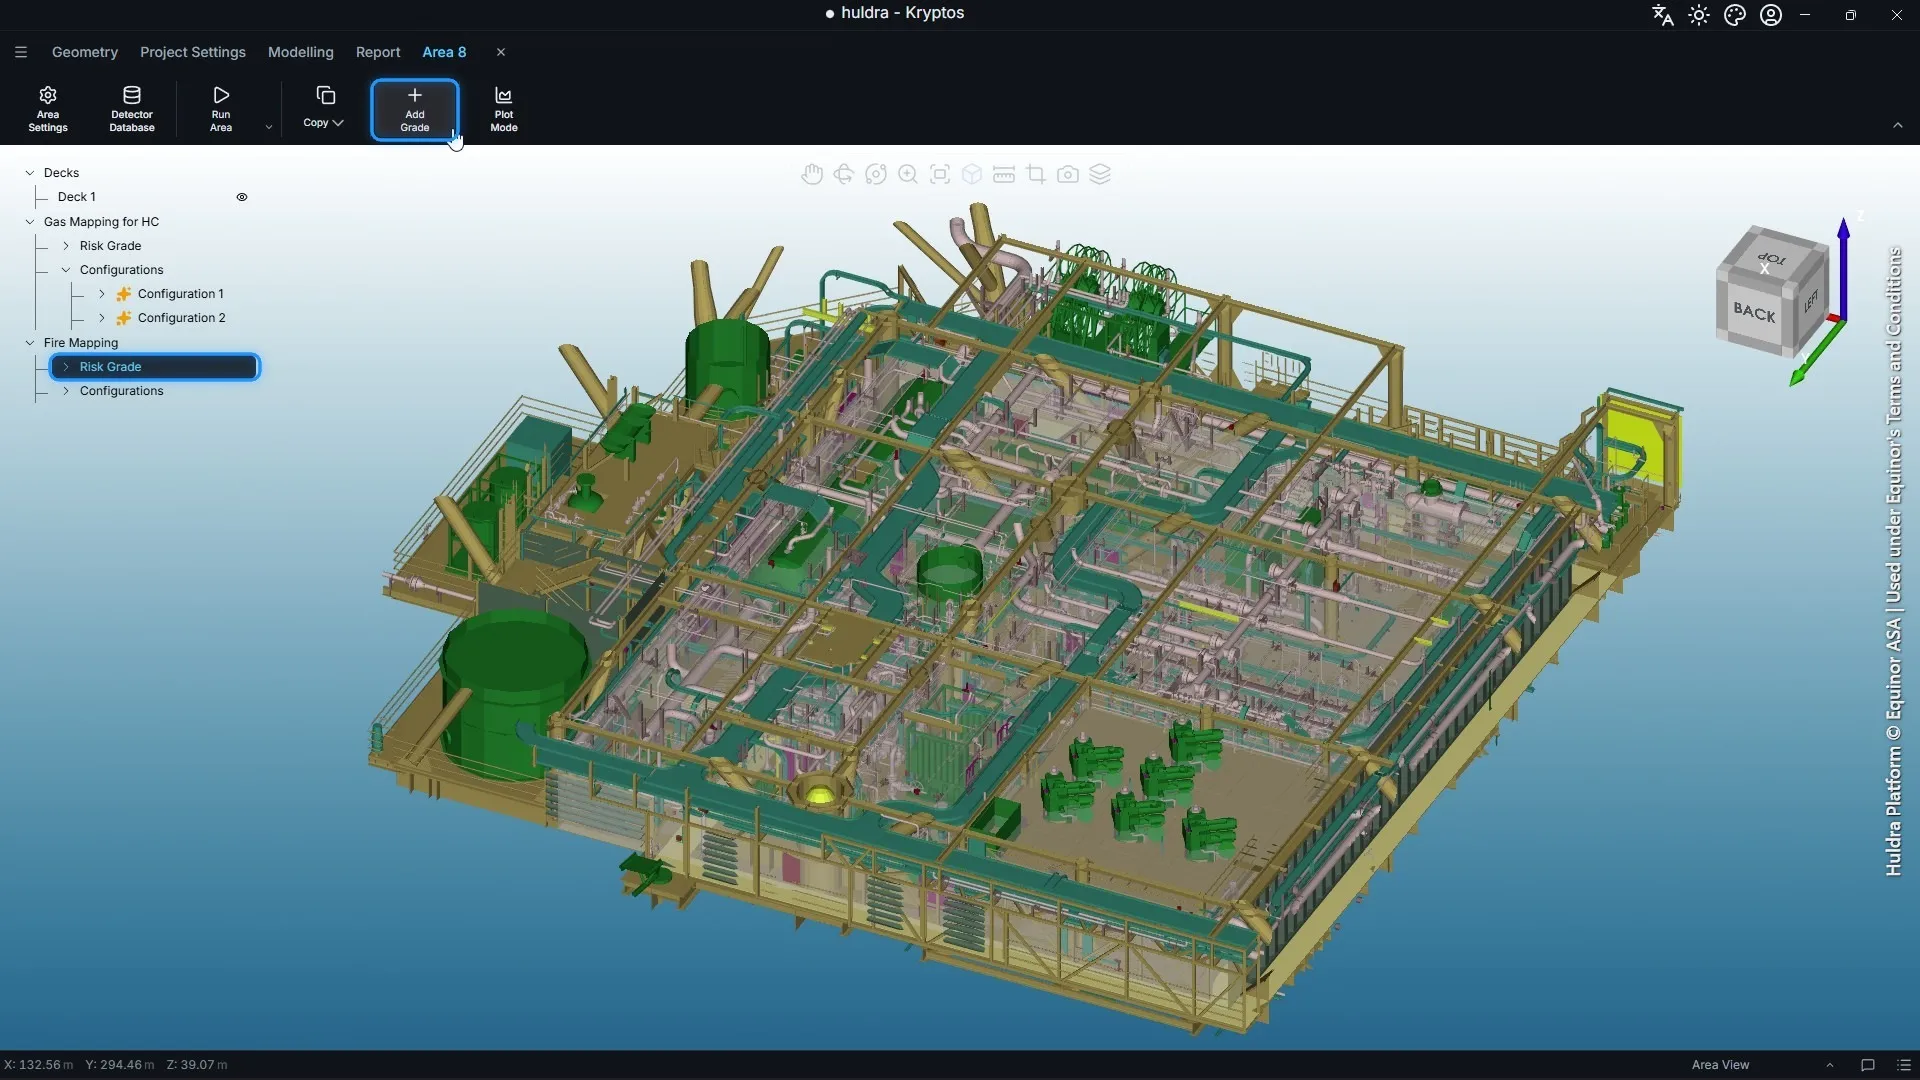
- Choose a Shape, a Draw Plane and the Extent, then click Draw Grade.
- Draw the outline in the 3D view and click Complete.
- Select the new grade in the tree and set its Grade Type to Grade A.
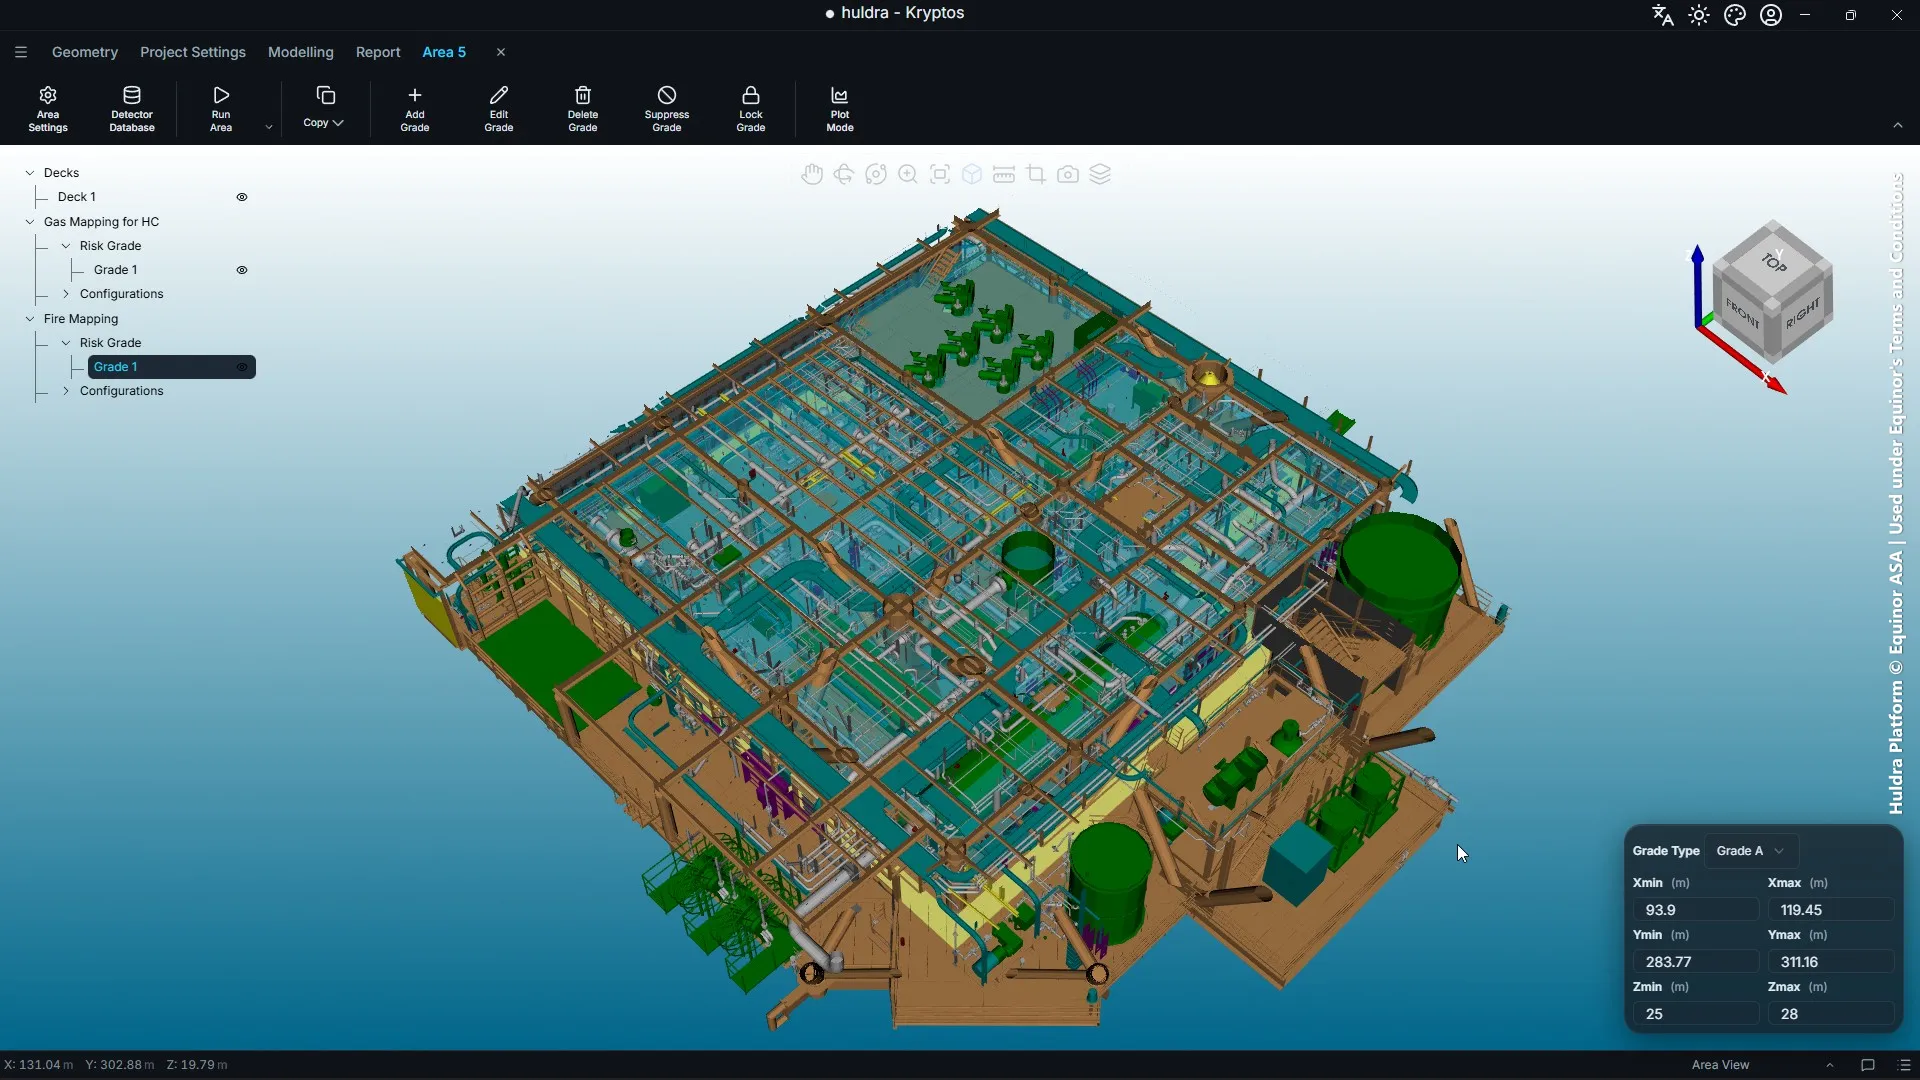
The blue highlighted part is the risk grade we used: a box of 25 × 27 × 3 m.
How tall you draw the grade matters. A taller grade is more space for the detectors to see into, so it needs more detectors. The shopping trip in Shop for fire detectors with rapid auto-optimisation in Kryptos tests grades 3 m, 4 m and 5 m tall.
Step 5: Draw the deck
Kryptos only places detectors on decks: floors, platforms and walkways where a detector can be mounted. Detector heights are measured from the deck, so the deck also sets how high each detector sits.
- Select Decks in the area tree and click Add Deck.
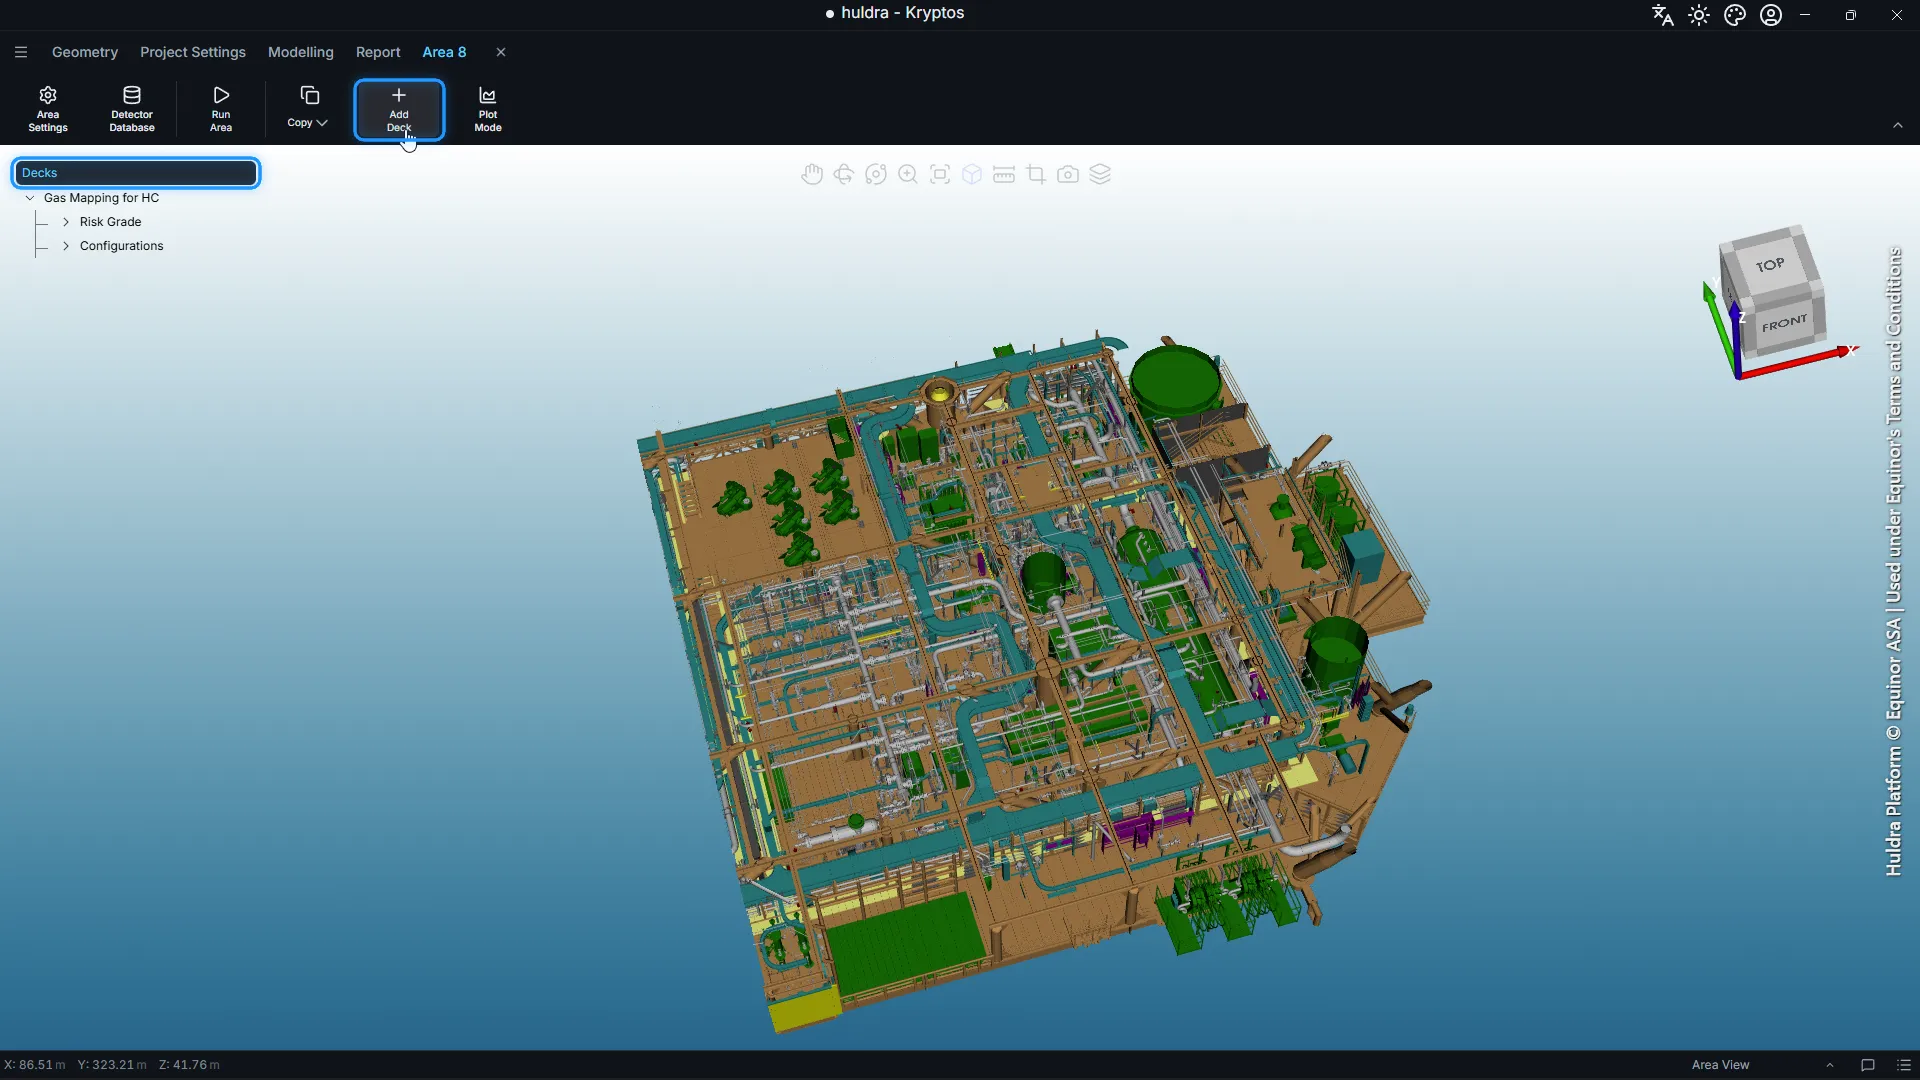
- Enter the Z Level of the floor, pick a shape and click Draw Deck.
- Draw the deck in the 3D view and click Complete.
An area without a deck cannot be optimised, because there is nowhere to put the detectors.
Fire detectors can also hang from above. Tick Hanging Deck when drawing a deck for an access platform or a support pillar, where a detector can be hung looking down. Detectors on a hanging deck can go above or below its level. The shopping trip compares detectors on the normal deck, on a hanging deck, and on both.
Step 6: Set the targets and limits in Project Settings
Open the Project Settings tab. These settings apply to every area in the project.
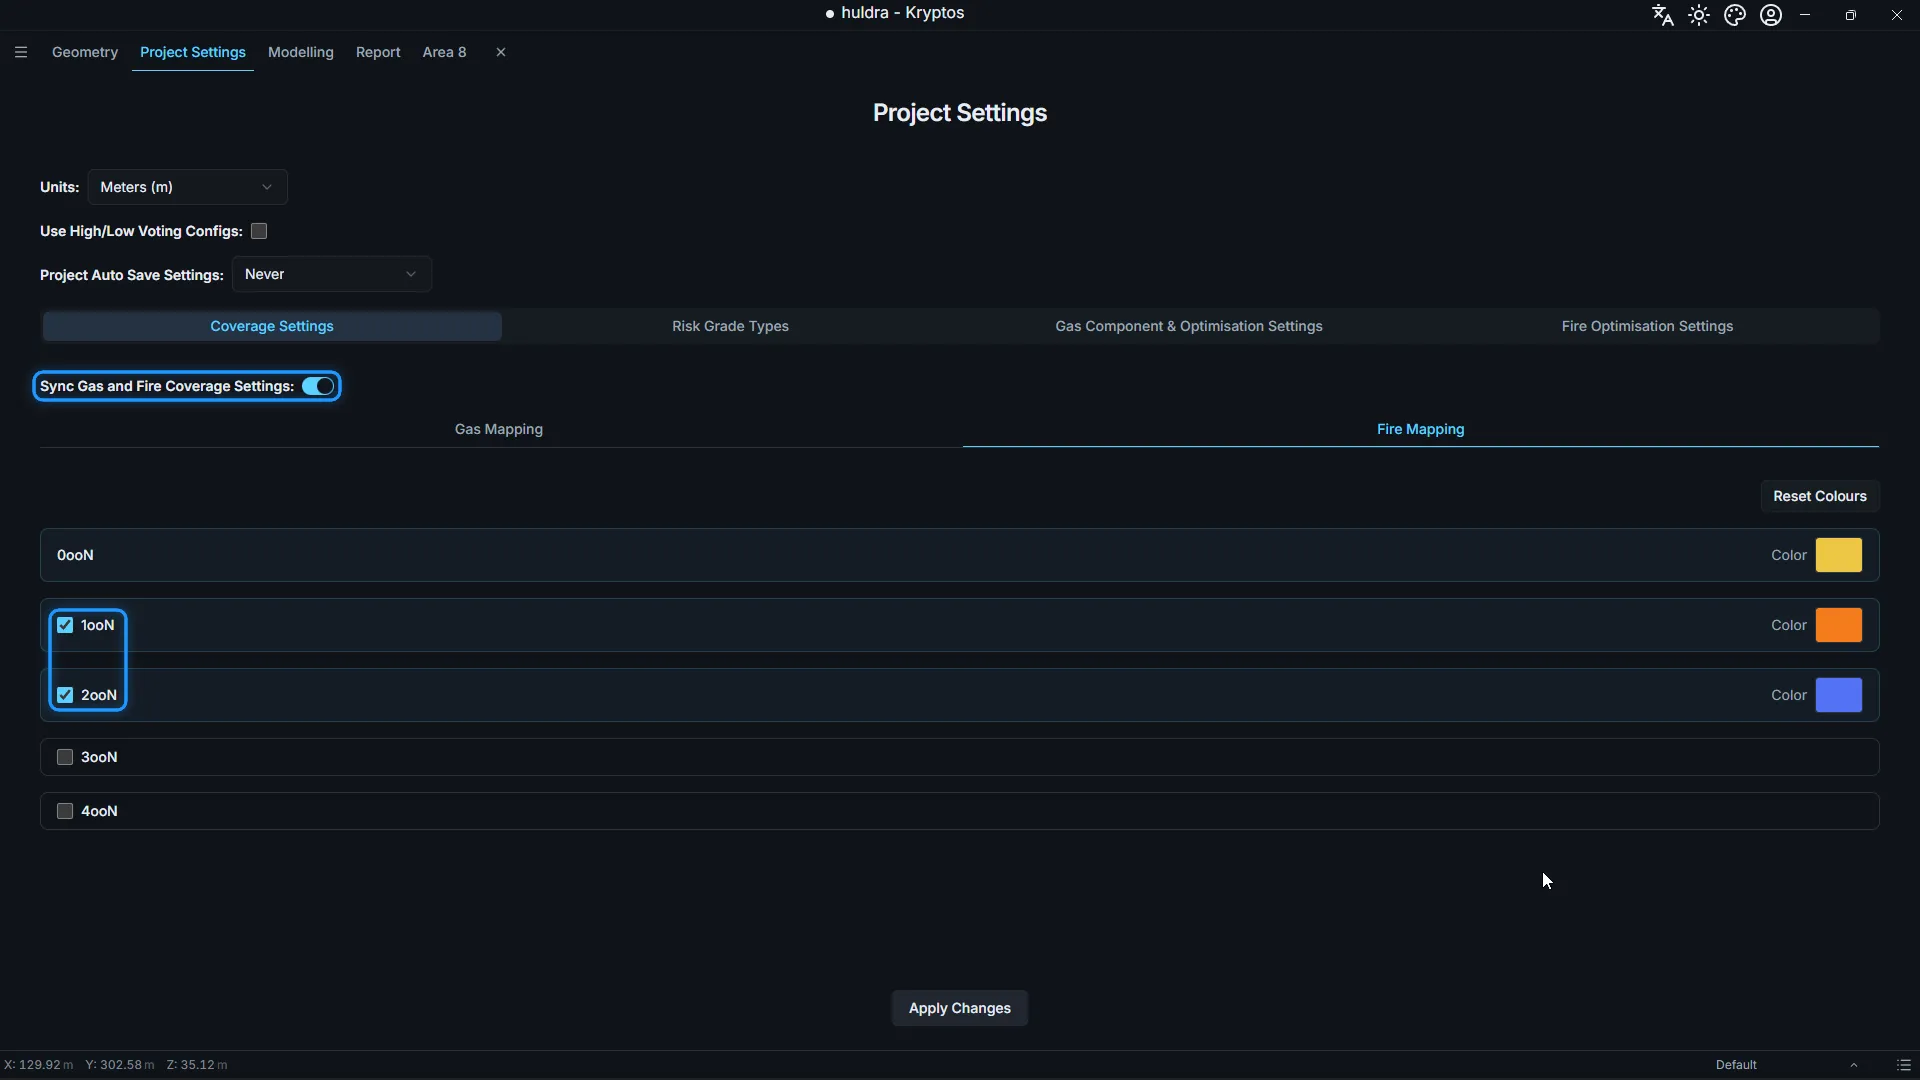
Coverage Settings
Under Fire Mapping, tick the voting levels you need. We used 1ooN (at least one detector sees the fire) and 2ooN (at least two see it).
Two detectors agreeing is what usually starts the fire response, so 2ooN is the number most studies care about. Sync Gas and Fire Coverage Settings keeps these the same for gas mapping too. Turn it off to set fire up on its own.
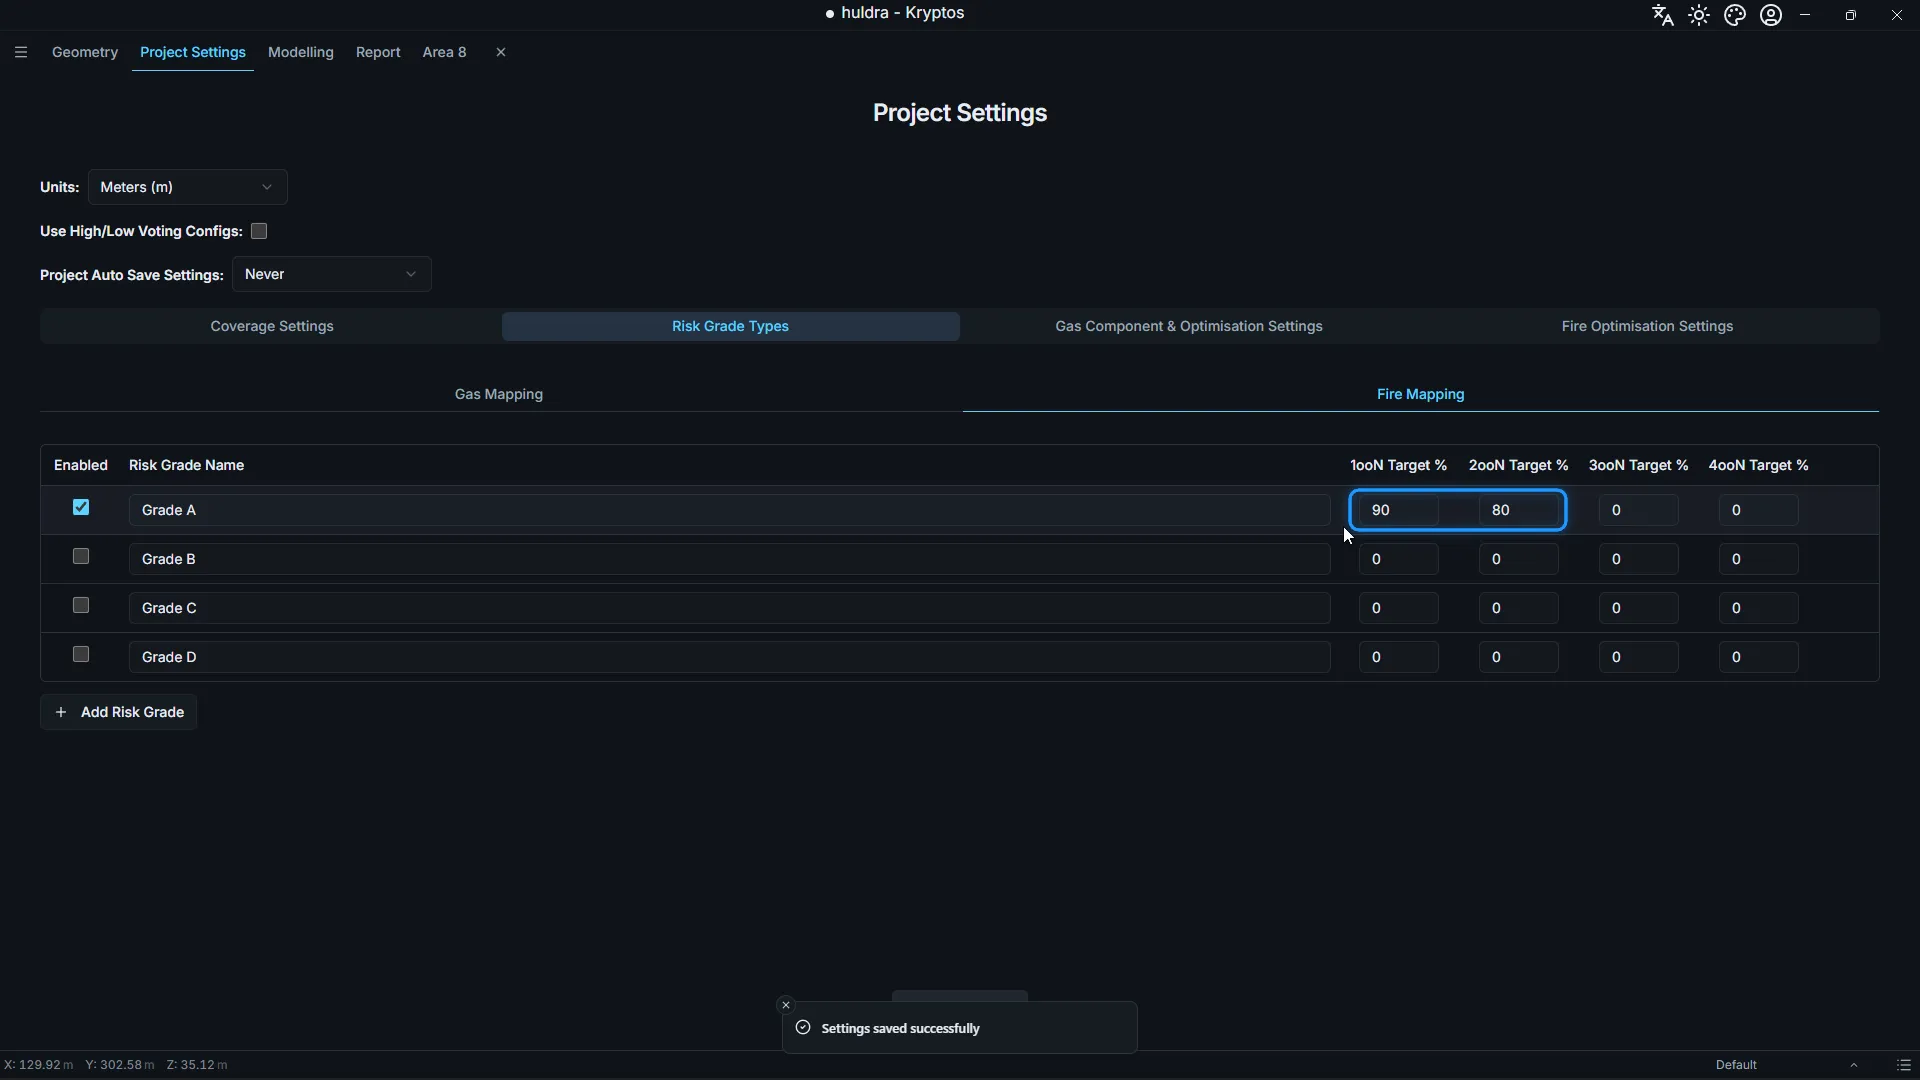
Risk Grade Types
On the Fire Mapping tab, enter the target coverage for each grade. We set Grade A to 90% at 1ooN and 80% at 2ooN. A target of 0% asks for nothing.
Fire Optimisation Settings
These are the limits the optimiser works within:
| Setting | What it limits | We used |
|---|---|---|
| Fire Detector Deck Constraints | How high above a deck a detector may go | 2 m to 5 m |
| Hanging Fire Detector Deck Constraints | How far above or below a hanging deck a detector may go | −1 m to 1 m |
| Fire Detector Tilt Constraints | How far a detector may point down | −40° to −5° |
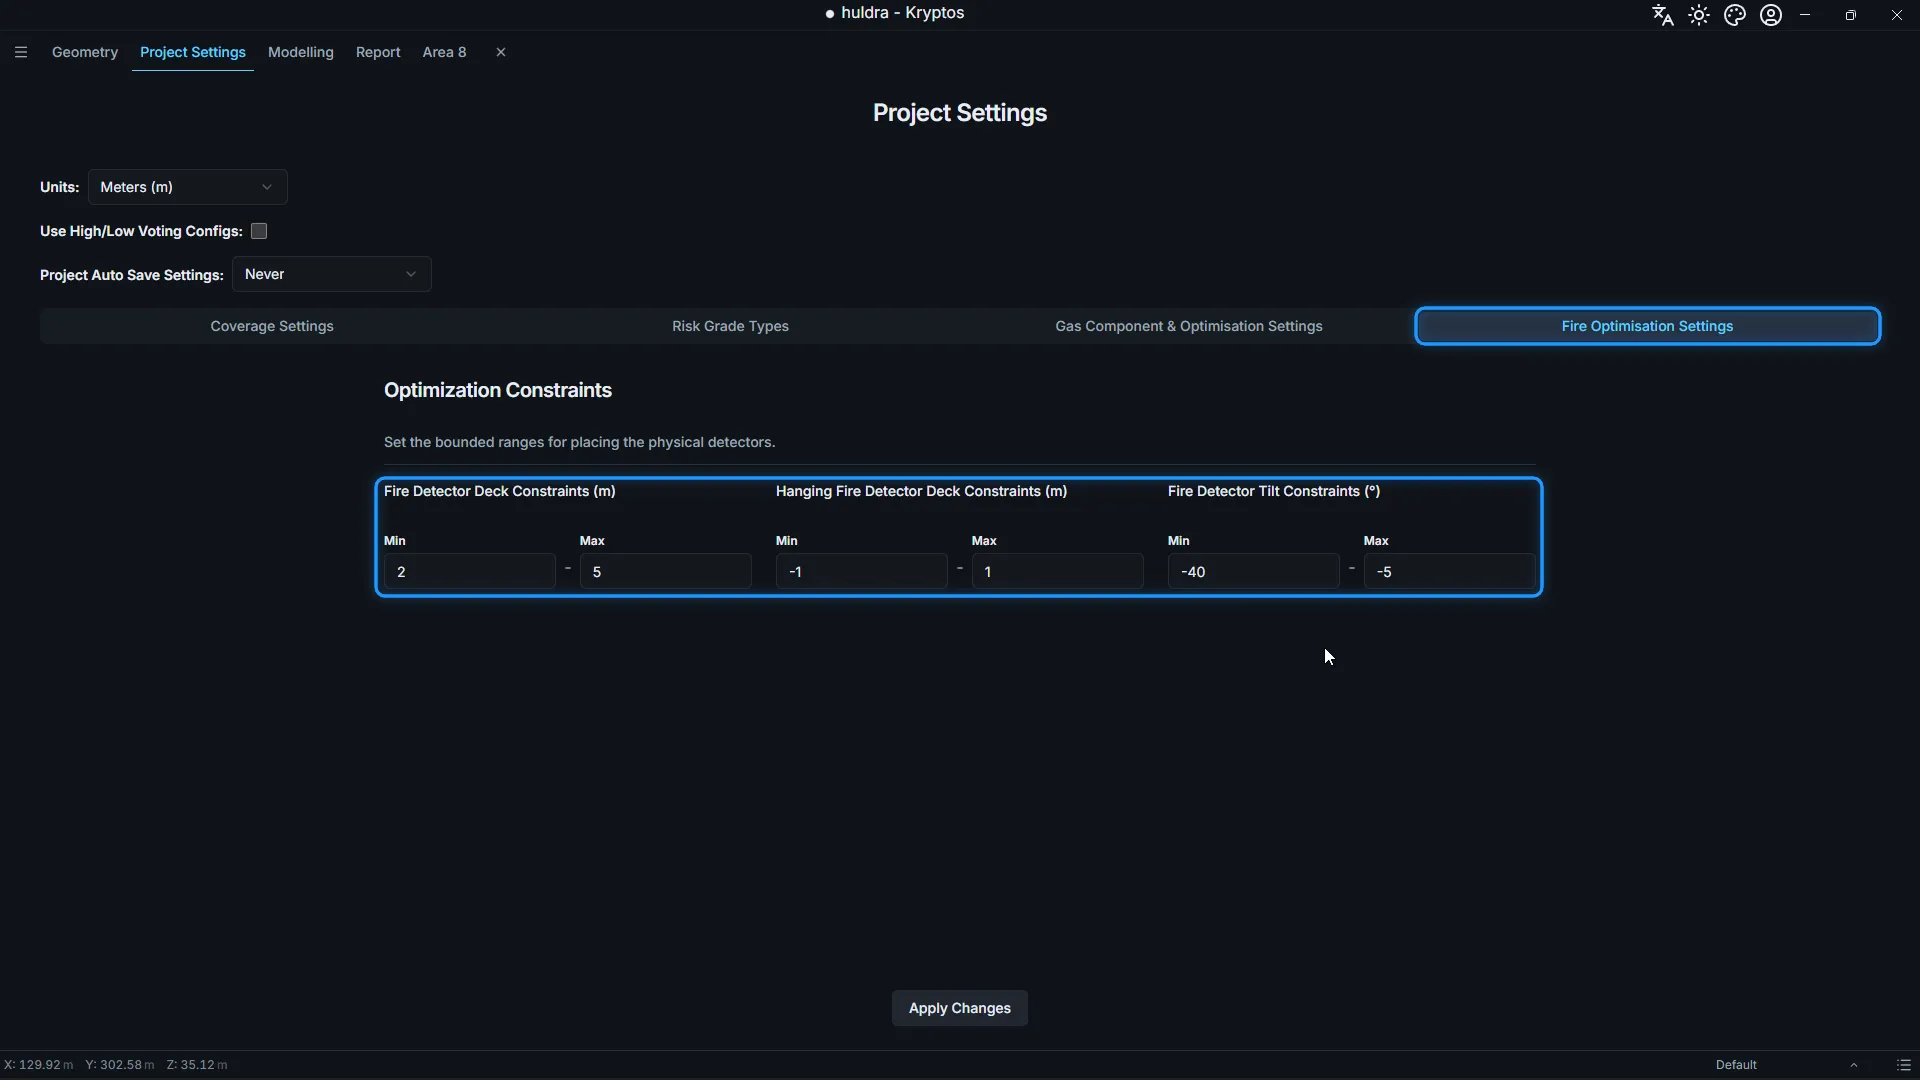
Tilt is negative when the detector points down. The steepest tilt, −40°, goes in the Min box.
Wider limits give Kryptos more positions to try. Narrow ones can make the targets hard to reach. Click Apply Changes.
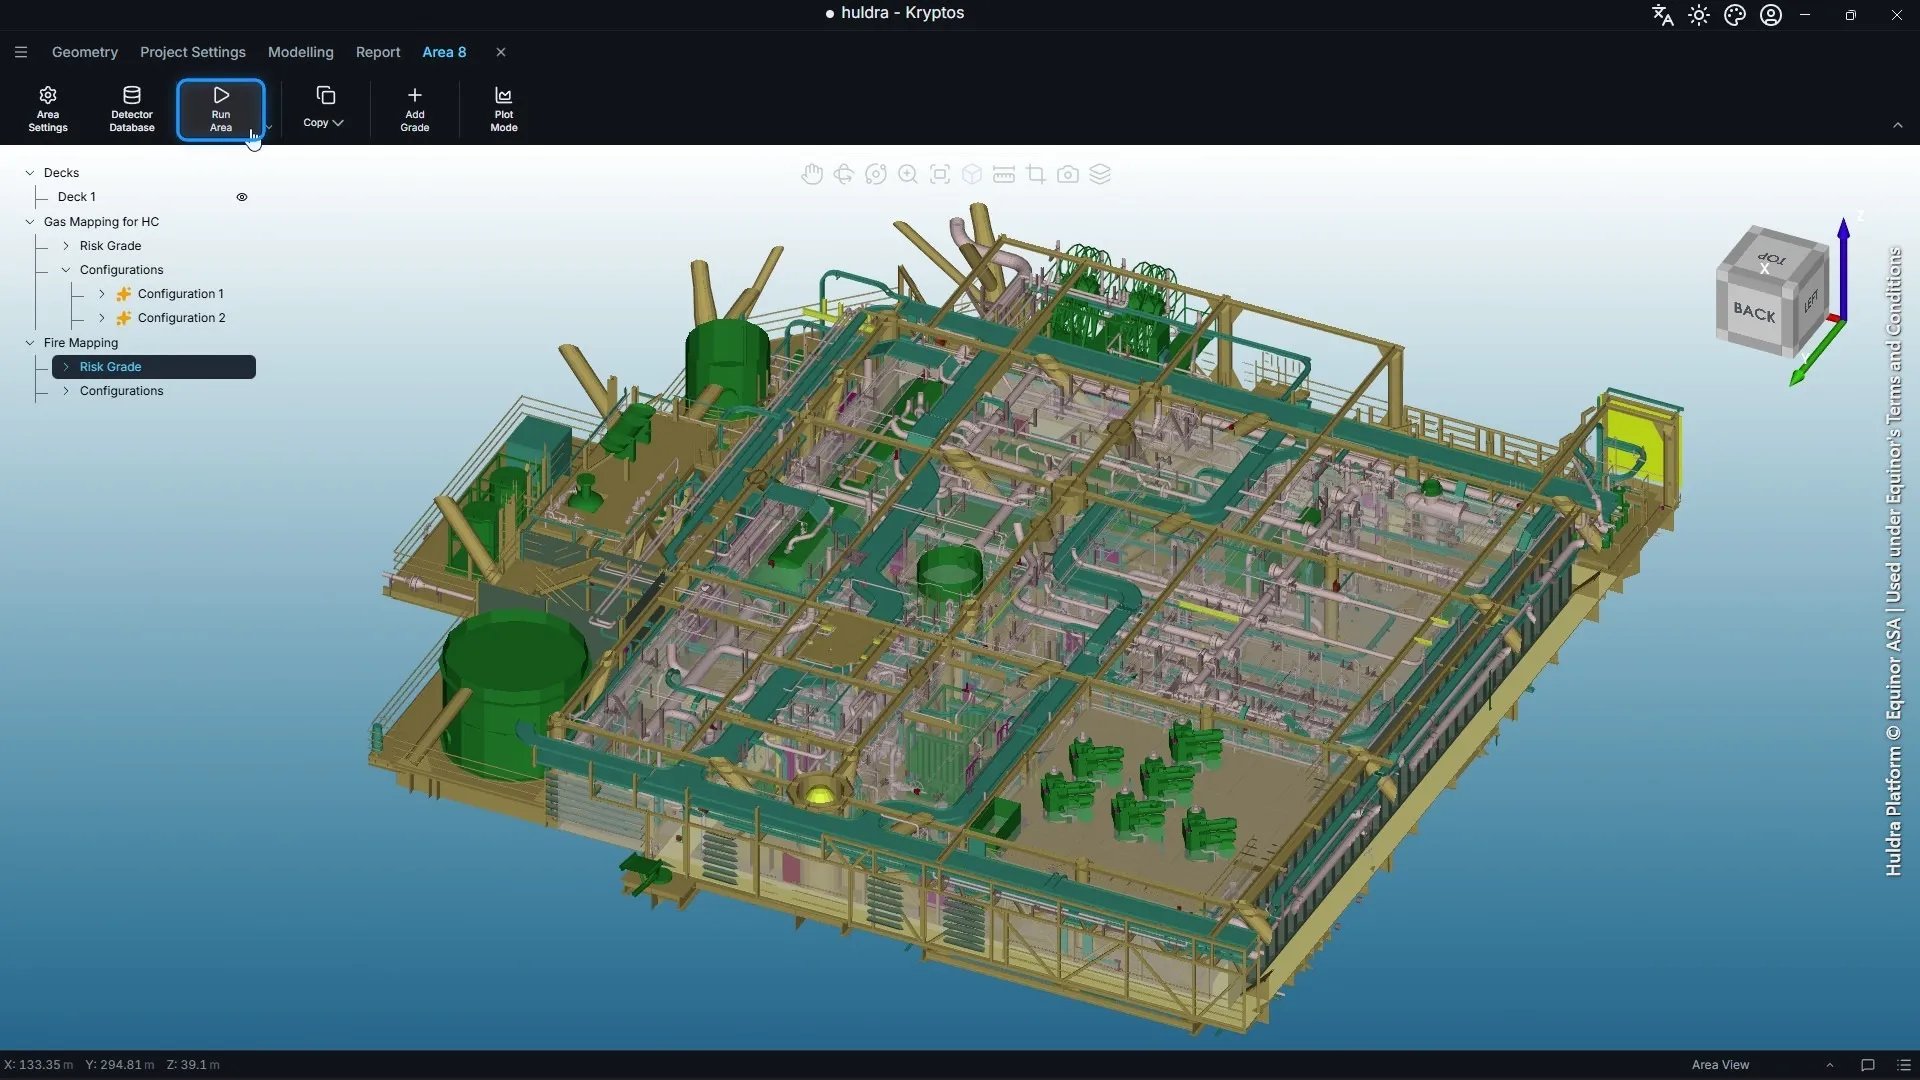
Step 7: Run the area
Go back to the area and click Run Area. This works out which parts of the grade each possible detector position can see. The optimiser needs it before it starts.
Step 8: Start the optimisation
- Under Fire Mapping, add a new, empty configuration and select it.
- Click Start Optimisation.
For every detector, Kryptos chooses where it goes, which way it faces and how far it tilts down. Follow the run in the Job Queue, from the icon at the bottom right of the window. Its live chart shows the coverage at each voting level against its target.
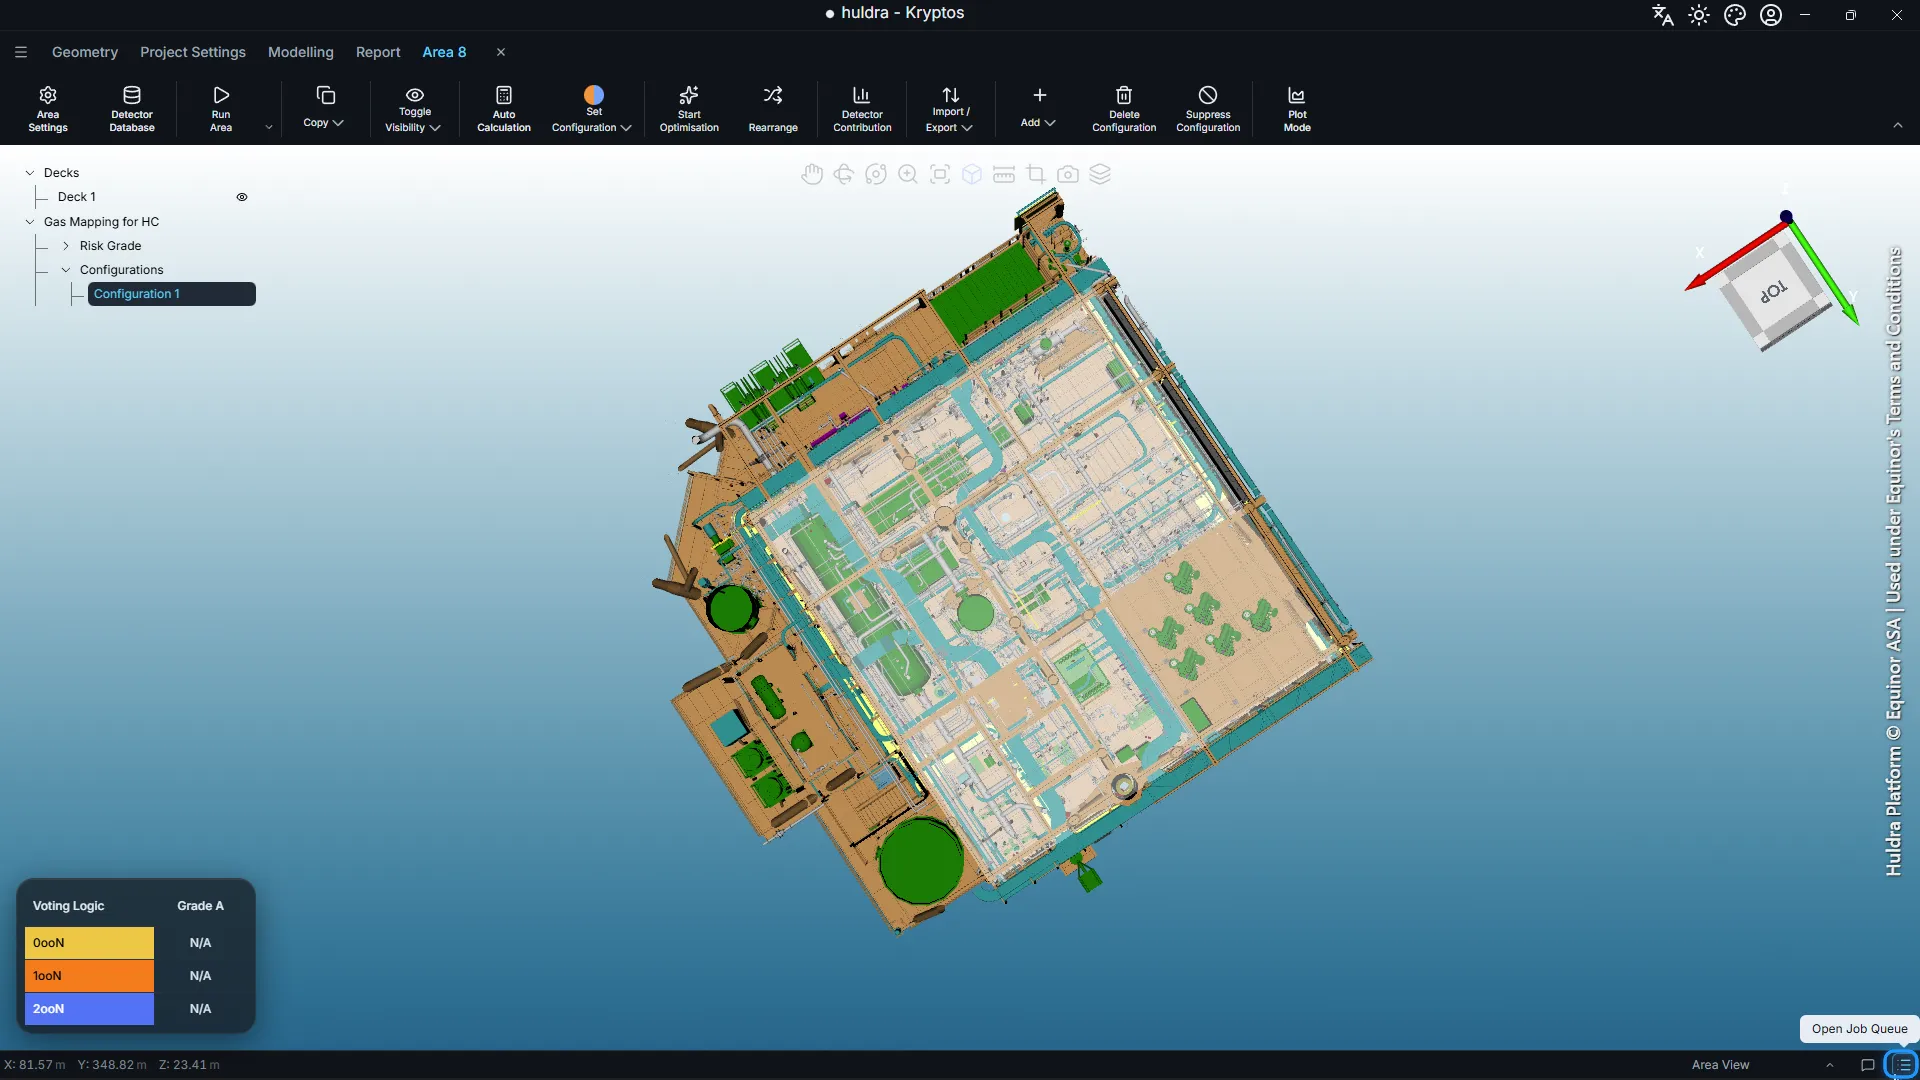
Tip: If the project already has detectors that must stay where they are, add them to the configuration and lock them before you start. Kryptos counts what they see and places the new detectors around them.
Step 9: Check the result
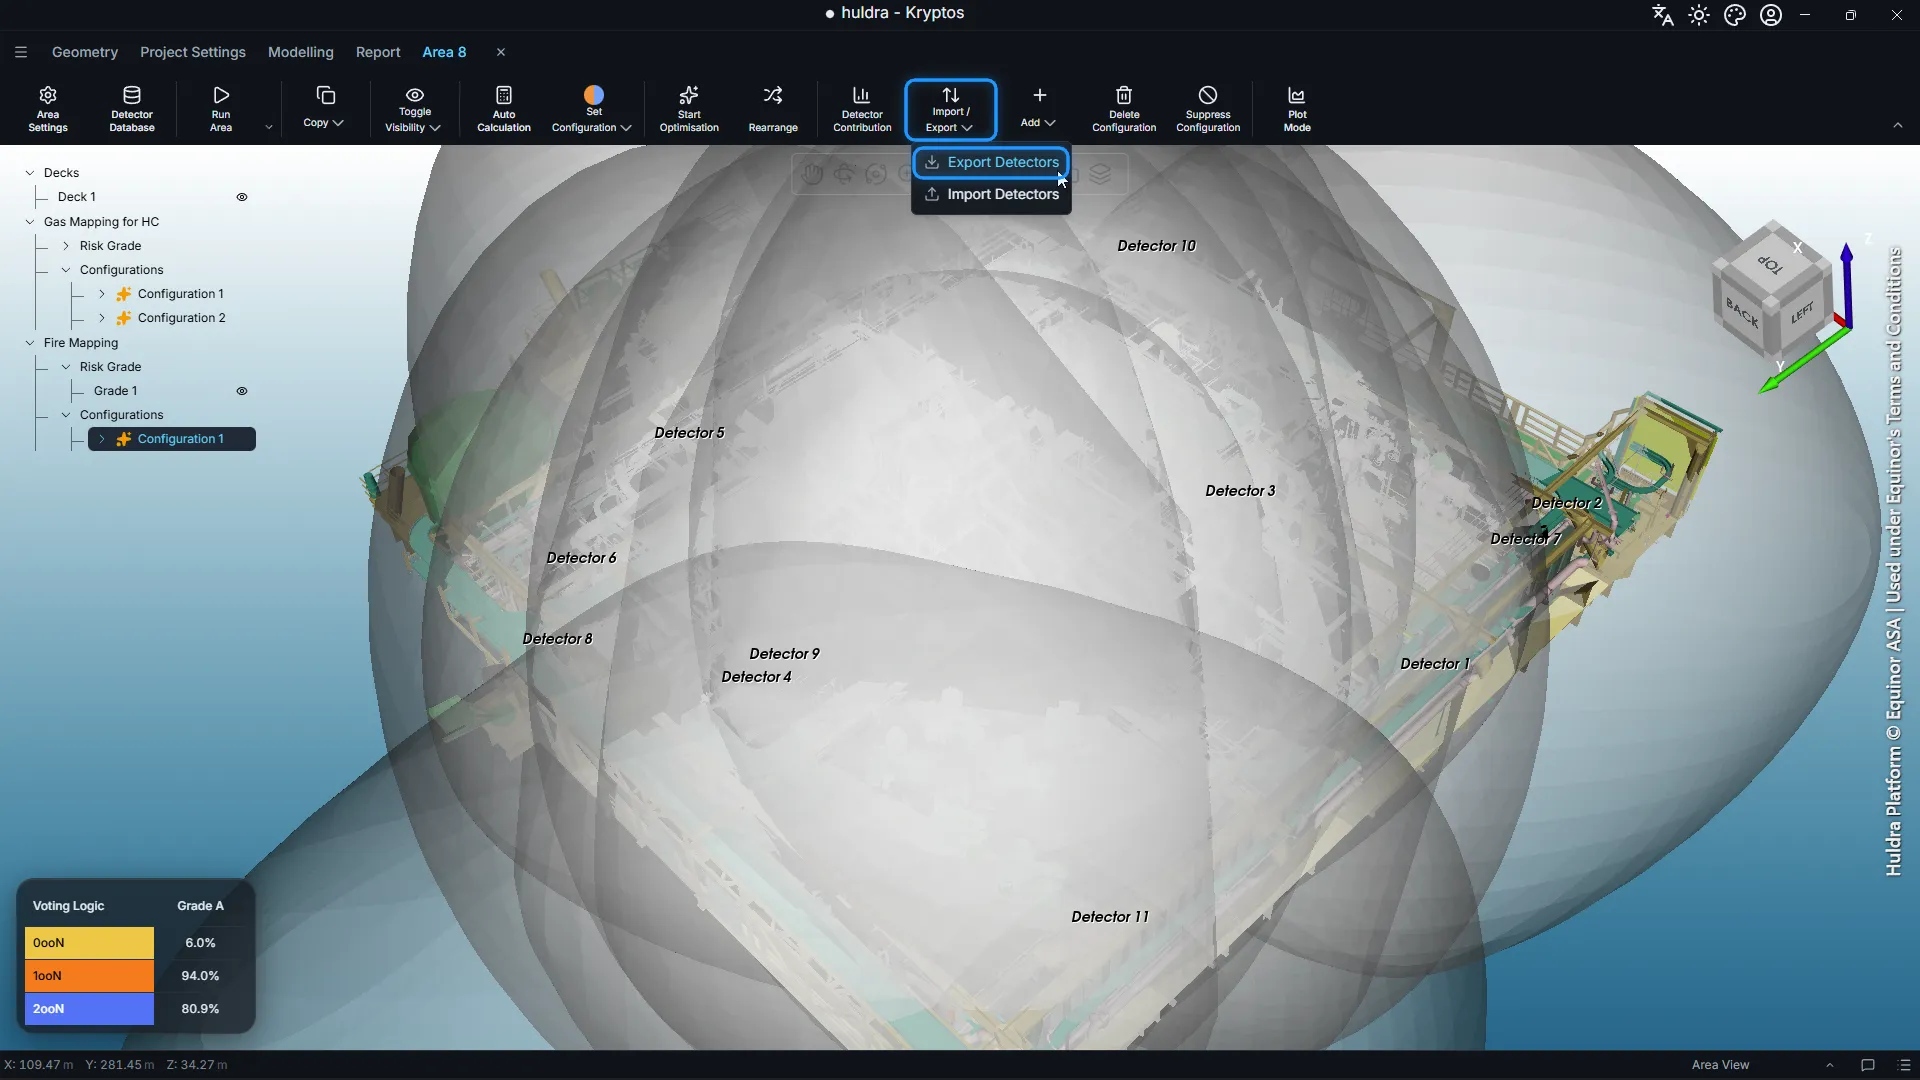
When the run finishes, the detectors appear in the 3D view and in the tree under the configuration. Each one is drawn as its cone of view. The Voting Logic panel at the bottom left shows the coverage.
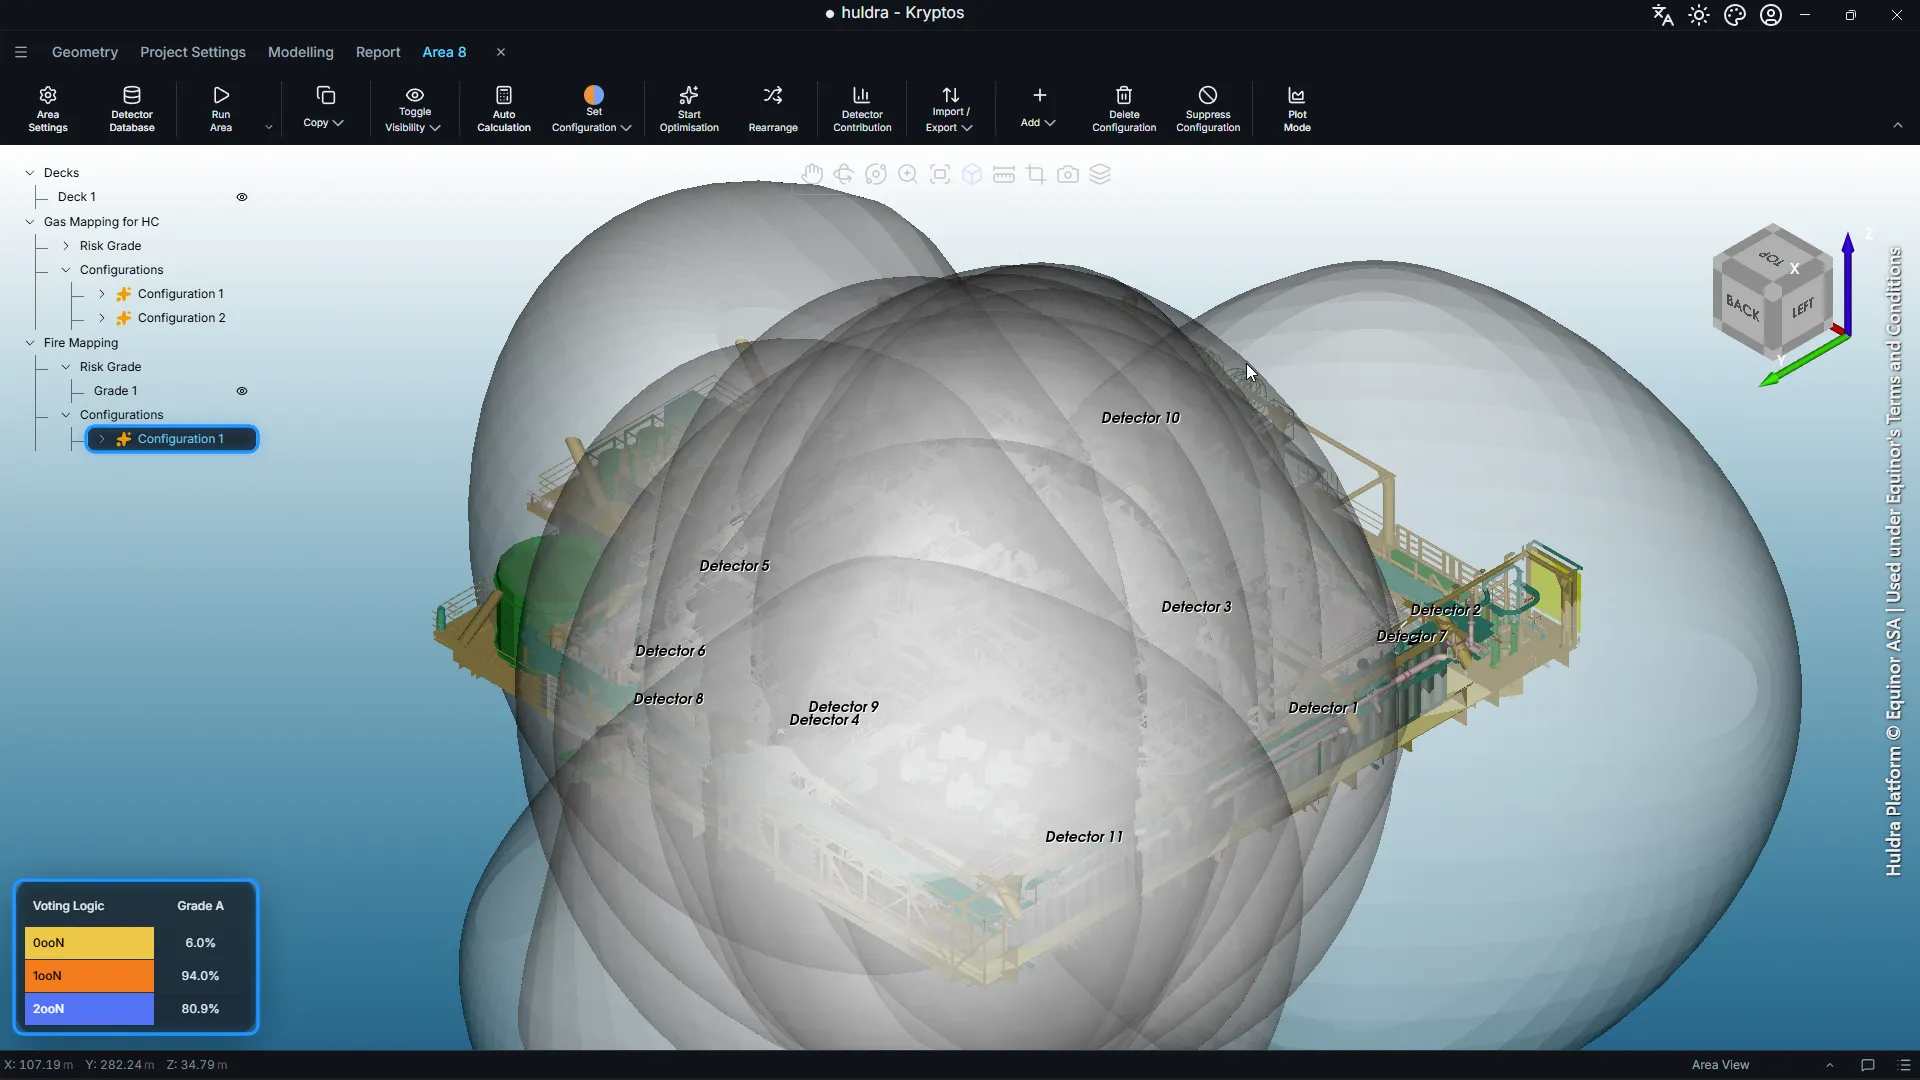
With Fire Area (Varying), Kryptos placed 11 detectors in 1 minute 3 seconds. It reached 94.0% at 1ooN and 80.9% at 2ooN, above both targets. Only 6.0% of the grade (0ooN) is seen by no detector.
To fine-tune a layout you already have, use Rearrange in the ribbon. Reach Target stops once the targets are met. Maximise Coverage gets the most from every detector.
Step 10: Generate the plot
The percentages say how much is covered. The plot shows where.
- Select the configuration and click Plot Mode.
- Leave Plot Type on 3D Plot and click Generate Plot.
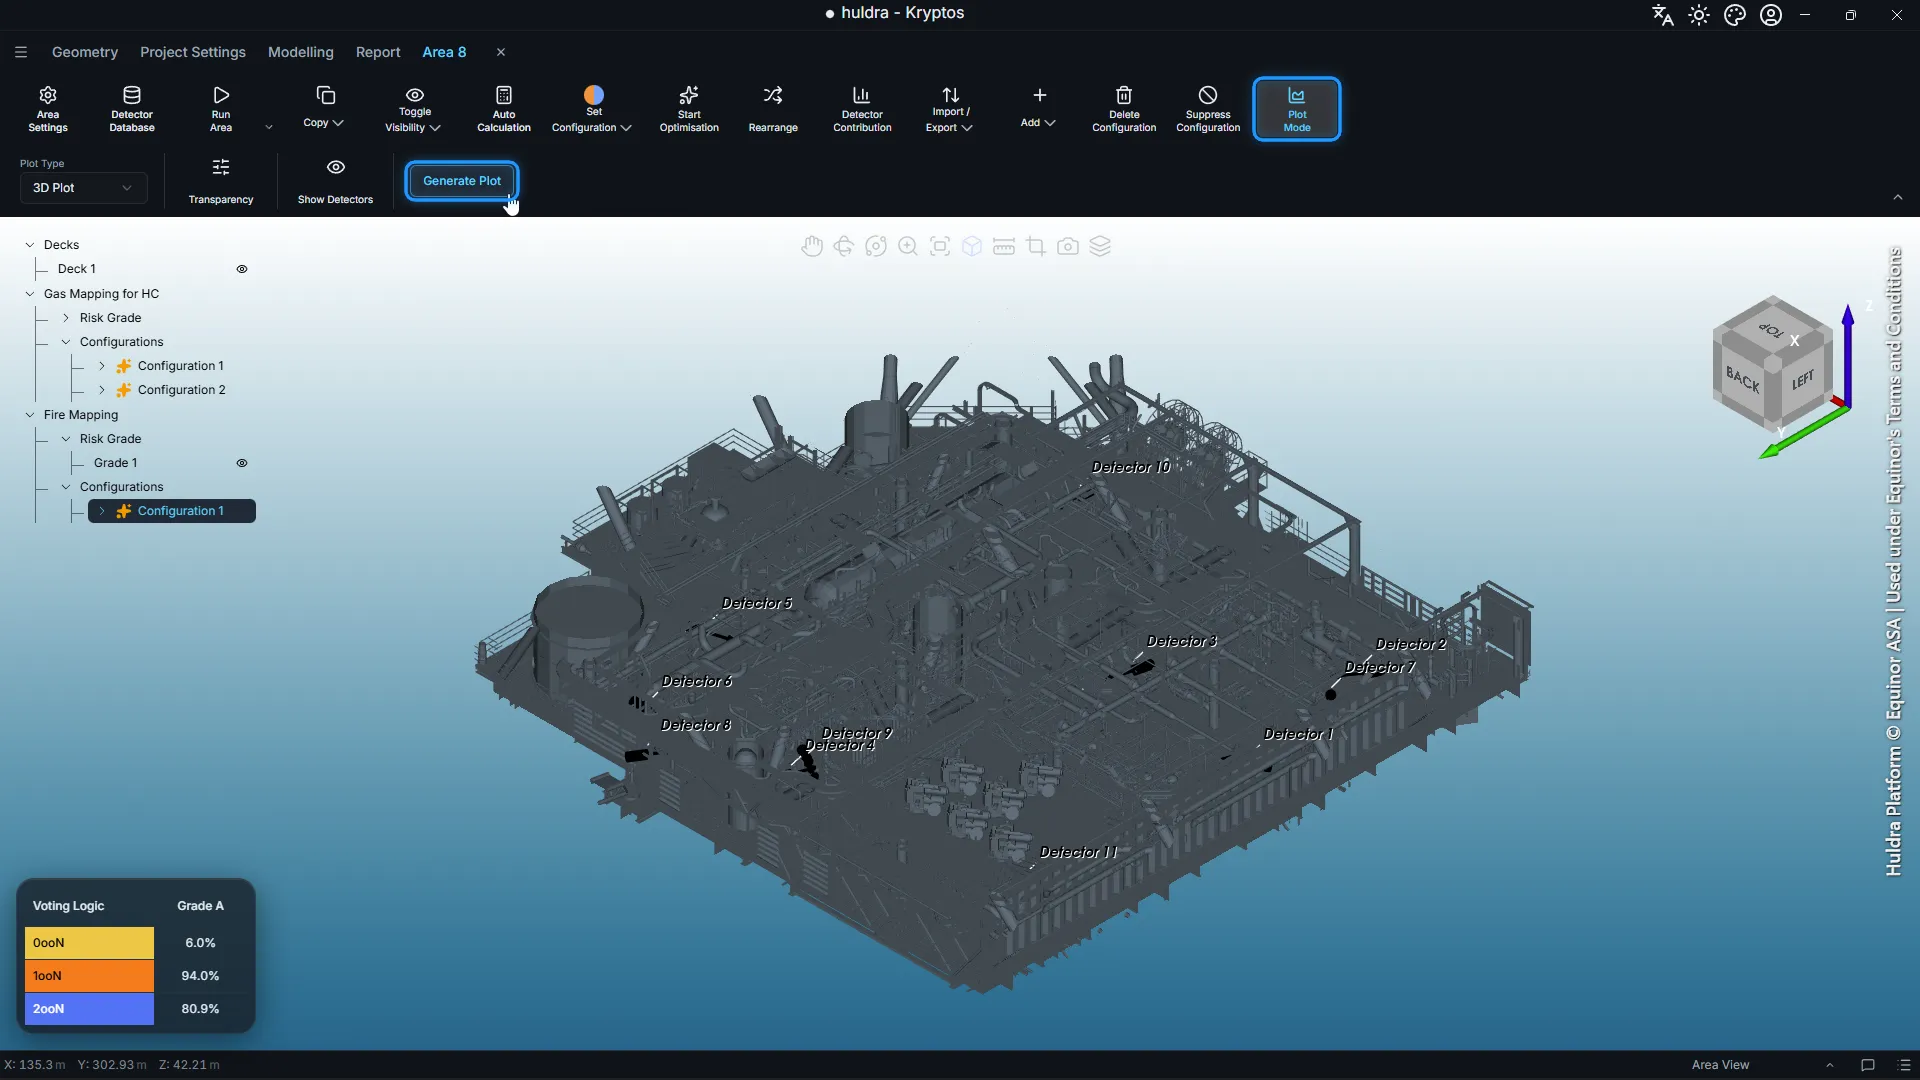
The grade fills in, coloured by voting level. The legend at the bottom right gives the colours: blue is 2ooN, orange is 1ooN and yellow is 0ooN.
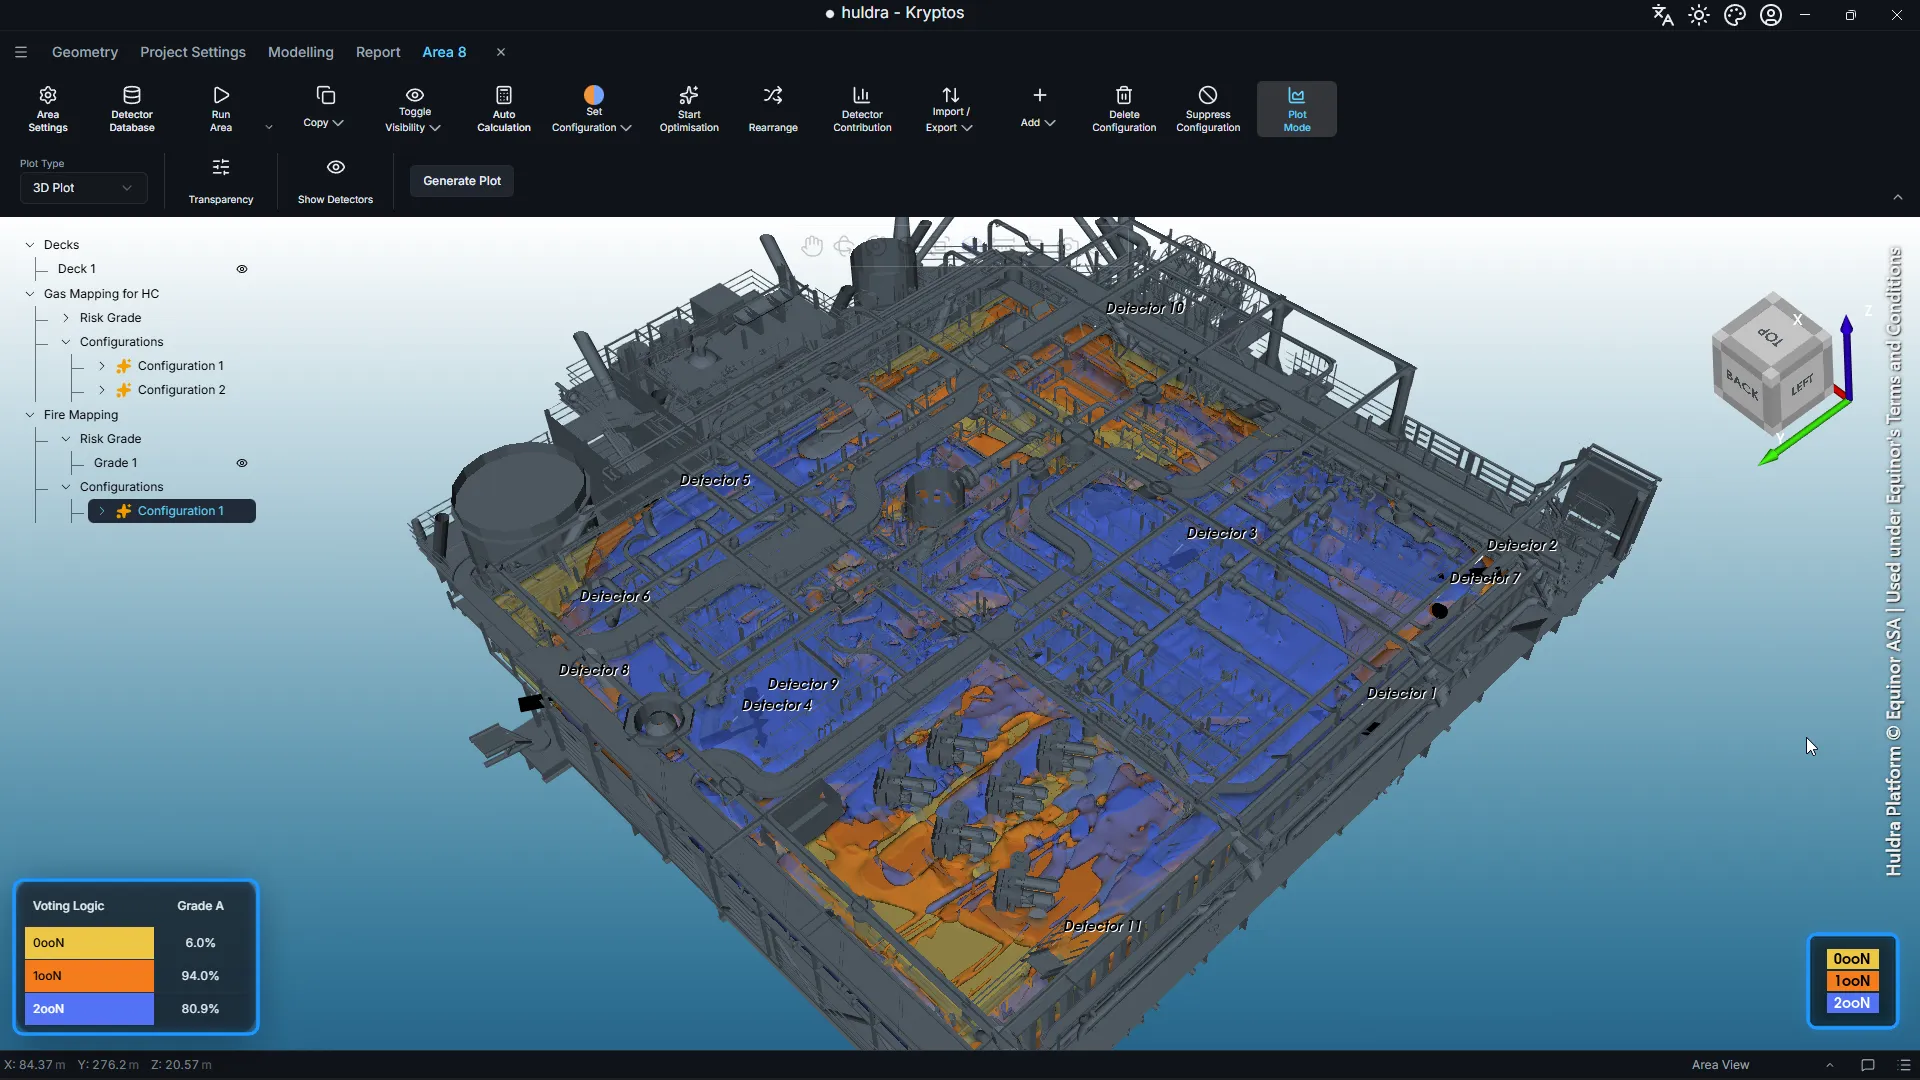
Most of the deck is blue. The orange patches sit behind and between equipment, such as the group of pumps at the front, where only one detector has a clear view. Fire coverage is about lines of sight, so the gaps follow the equipment.
A few more options in the same row:
- Transparency makes the plot more see-through, so you can see the equipment under it.
- Show Detectors shows or hides the detectors and their labels.
- Plot Type set to Slice Plot gives flat cuts through the area. This is the quickest way to find gaps behind vessels.
Step 11: Export the detectors
- Select the configuration.
- Click Import / Export, then Export Detectors.
- Choose where to save the file. Kryptos names it after the configuration, such as Configuration 1_detectors.xlsx.
For fire detectors, the workbook has one sheet, Fire Detectors:
| Column | What it holds |
|---|---|
| Detector Name | The name in the tree, such as Detector 1 |
| X, Y, Z | Where the detector sits, in project coordinates |
| Horizontal Angle | Which way it faces, in degrees |
| Vertical Tilt | How far it tilts up or down, in degrees |
That is everything needed to mount and aim each detector on site. The file also works the other way round. Edit it, or fill it in from another source, and use Import Detectors to bring the detectors back into a configuration.
Three detection methods, timed
We ran the same deck with each of the three fire detection methods. The detector, grade, targets and limits stayed the same. Only the method changed.
| Fire Area (Varying) | Fire Area (Fixed) | Point | |
|---|---|---|---|
| Fire size | 0.3 × 0.9 m | 0.3 × 0.9 m | none |
| Visible share needed | 100% at 27 m, down to 10% close in | 50% at any distance | a clear line of sight |
| Detectors placed | 11 | 19 | 53 |
| Total time | 1 min 3 s (63 s) | 2 min 18 s (138 s) | 5 min (300 s) |
| Time to find optimised position per detector | 5.7 s | 7.3 s | 5.7 s |
| Positions tried | 3,207 | 7,021 | 18,626 |
| Positions tried per second | about 51 | about 51 | about 62 |
| 1ooN / 2ooN reached | 94.0% / 80.9% | 93.9% / 80.6% | 91.3% / 80.2% |
Measured on a laptop with an Intel Core i7, 16 GB of RAM and 8 GB of graphics memory.
What the numbers show:
- The method changes the detector count far more than the time to place each one. Finding the optimised position for each detector took between 5.7 and 7.3 seconds, whichever method was used. The total time follows the number of detectors the method needs.
- Fire Area (Varying) needed the fewest detectors. Close in, it asks to see only 10% of the fire. A fire partly hidden behind a pipe still counts as seen, as it would for a real detector nearby.
- Fire Area (Fixed) needed 19. Asking for half of the fire at every distance is harder at long range and easier close in, so on balance it needs more detectors than Varying.
- Point needed 53. Every spot must be in clear sight, with nothing in the way. On a deck this crowded, that takes many detectors from many angles.
- Kryptos tried about 50 to 60 positions a second. Each one is a place, a direction and a tilt, checked against the whole grade.
Your times depend on the size of the area, the method and your computer.
Shop for detectors with it
Once one run takes a minute or two, you can ask questions you could not afford to ask before. The most useful one: which detector should we buy? We ran 27 optimisations in one hour on this deck to compare three detector models, three grade heights and three ways of mounting the detectors. See Shop for fire detectors with rapid auto-optimisation in Kryptos.
What’s next
The next post puts the speed to work by comparing three detector models on this deck: Shop for fire detectors with rapid auto-optimisation in Kryptos. After that, turn the results into a Word report, in one language or two side by side. See Your Fire & Gas report, in 31 languages or two side by side.
Credits and acknowledgements
The plant model in this post is the Huldra platform, © Equinor ASA, used under Equinor’s Terms and Conditions. Our thanks to Equinor for making the Huldra data openly available, which lets us show Kryptos working on a real offshore platform.
Every screenshot and video that shows the model carries this credit. Equinor has not reviewed or endorsed this post or Kryptos.
Model credit: Huldra Platform © Equinor ASA | Used under Equinor's Terms and Conditions